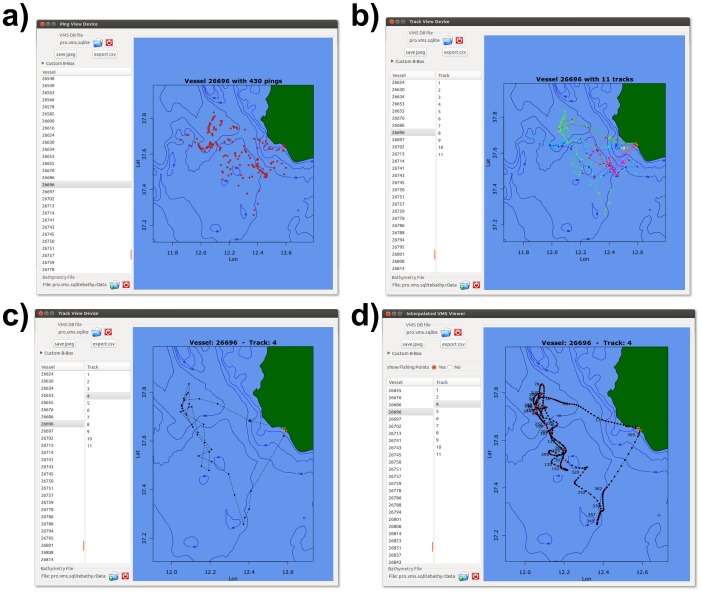
Figure 5. VMSbase interfaces for a) the ping viewer.
Single VMS positions are represented by red points; b) the track viewer in which all the tracks for a single vessel are plotted; c) the track viewer in which only a single track for a single vessel is plotted; d) the interpolation viewer in which a single track is plotted, with black points representing interpolated pings and red points representing real pings. It should be noted that, in all cases, the main isobaths are visualized as computed by the “Get Isobaths” tool in the main interface. The names of the datasets as well as the data in the figure are just for the sake of illustration.

