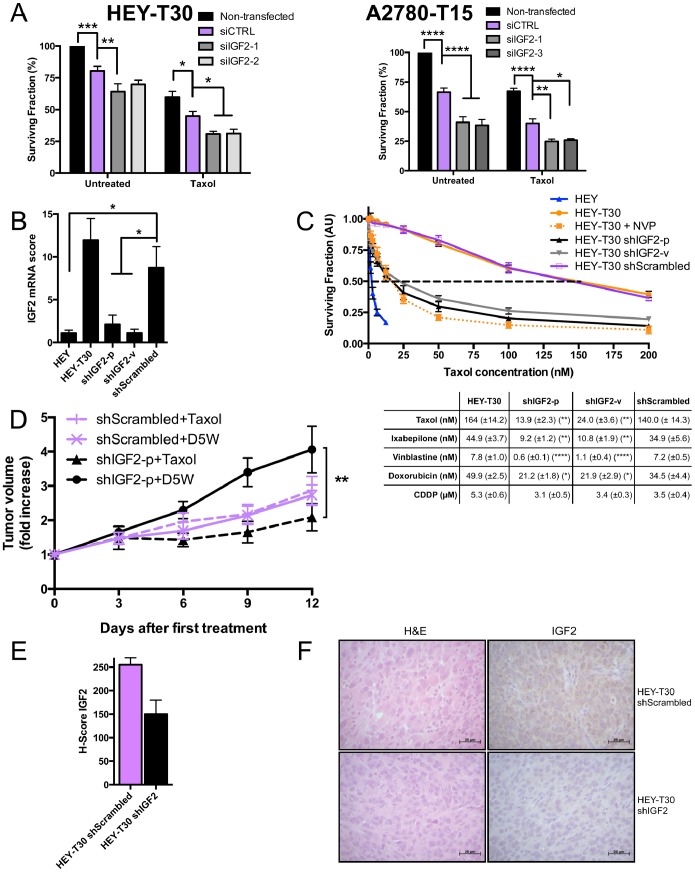
Figure 5. IGF2 knockdown restores Taxol sensitivity.
(A) Taxol sensitivity after IGF2 knockdown by siRNA. HEY-T30 and A2780-T15 cells were transfected with control nontargeting siRNA (siCTRL) or siRNAs targeting IGF2 (siIGF2-1, siIGF2-2, siIGF2-3), and treated with DMSO or Taxol at the approximate IC50 (100 nM for HEY-T30 and 15 nM for A2780-T15). The surviving fraction was reduced after IGF2 siRNA transfection compared to control siRNA transfection. The effect of Taxol was significantly enhanced in both HEY-T30 and A2780-T15 by IGF2 siRNA transfection compared with control siRNA transfection. Bars represent the mean of four independent experiments (each done in duplicate)±SEM; *p<0.05, **p<0.01, ***p<0.001, ****p<0.0001; Two-way ANOVA with Bonferroni posttest. (B) IGF2 mRNA after stable knockdown with shRNA. HEY-T30 cells were transfected with shRNA targeting IGF2 by plasmid transfection (shIGF2-p) or lentiviral infection (shIGF2-v), or with a control vector containing the scrambled version of the IGF2 targeting sequence (shScrambled). Clonal stably-transfected cell lines were used for all experiments. IGF2 mRNA levels are depicted in bars±SEM. The shIGF2-p and shIGF2-v cell lines have low IGF2 mRNA levels similar to HEY, whereas HEY-T30 and shScrambled cell lines had several-fold higher mRNA expression levels. (n>6 independent experiments, each done in triplicate) *p<0.05; One-way ANOVA with Bonferroni posttest. (C) Cytotoxicity assays in cell lines with IGF2 shRNA. The indicated cell lines were treated with serial dilutions of Taxol, and sensitivity to Taxol determined by the sulforhodamine B assay. The dose-response curves are shown on the left, with the mean±SEM go the surviving fraction of cells relative to untreated cells shown at the indicated Taxol concentrations. The mean IC50 values±SEM for the indicated cell lines and drugs are shown in the table below. HEY T30 shIGF2-p and HEY-T30 shIGF2-v were significantly more sensitive to Taxol, ixabepilone, and vinblastine compared to control transfected HEY-T30 (shScrambled) or untransfected HEY-T30. The efficacy of IGF2 knockdown at restoring sensitivity to Taxol was similar to NVP-AEW541 treatment. Only 1.6 fold sensitization to doxorubicin and no effect on cisplatin sensitivity were observed in shIGF2 lines compared to shScrambled or untransfected HEY-T30. Asterisks denote the statistical significance when comparing the IC50 for the indicated shIGF2 cell line versus shScrambled, where *p<0.05, **p<0.01, ****p<0.0001; Two-way ANOVA with Bonferroni posttest. (n = 5 independent experiments each done in six replicates). (D) Xenograft growth with Taxol treatment of HEY-T30 shIGF2-p and HEY-T30 shScrambled. Female athymic nude mice were subcutaneously injected with 1 million HEY-T30 shScrambled or HEY-T30 shIGF2-p cells and tumors were allowed to grow to an average volume of 120 mm3. Mice were then treated with either D5W (vehicle) or Taxol at the MTD (described in 2D). Tumors were measured every three days, and data points show the mean tumor volume±SEM for each group at each time point. Two independent experiments were done for a total of 8–10 animals per group. shIGF2-p xenografts responded to Taxol treatment (triangle, dashed black line) and showed significantly tumor growth suppression compared to treatment with D5W (circle, solid black line); at day 12, **p<0.01 for shIGF2-p Taxol vs shIGF2-p D5W; One-way ANOVA with Bonferroni posttest. In contrast, HEY-T30 shScrambled xenografts did not respond to Taxol (+, dashed purple line) and continued growing at a similar rate as the vehicle-treated HEY-T30 shScrambled group (x, solid purple line). No significant difference in tumor size was observed between D5W-treated shIGF2-p and shScrambled xenografts at day 12. Representative tumor xenografts were excised on day 13 after treatment for further analysis. (E, F) IGF2 immunohistochemical staining of xenografts. Excised tumor xenografts (n = 2 animals per group) on day 13 after treatment initiation were formalin-fixed, paraffin embedded and sections stained with hematoxylin and eosin or with an anti-human IGF2 antibody. Staining was evaluated by the pathologist blinded to the groups and the mean of H-scores±SEM calculated and graphed (E). (F) Shows representative HEY-T30 shScrambled and HEY-T30 shIGF2 xenograft sections stained with hematoxylin and eosin (H&E) or with anti-IGF2 antibody (right panels). HEY-T30 shIGF2-p xenografts showed lower IGF2 expression when compared to HEY-T30 shScrambled.

