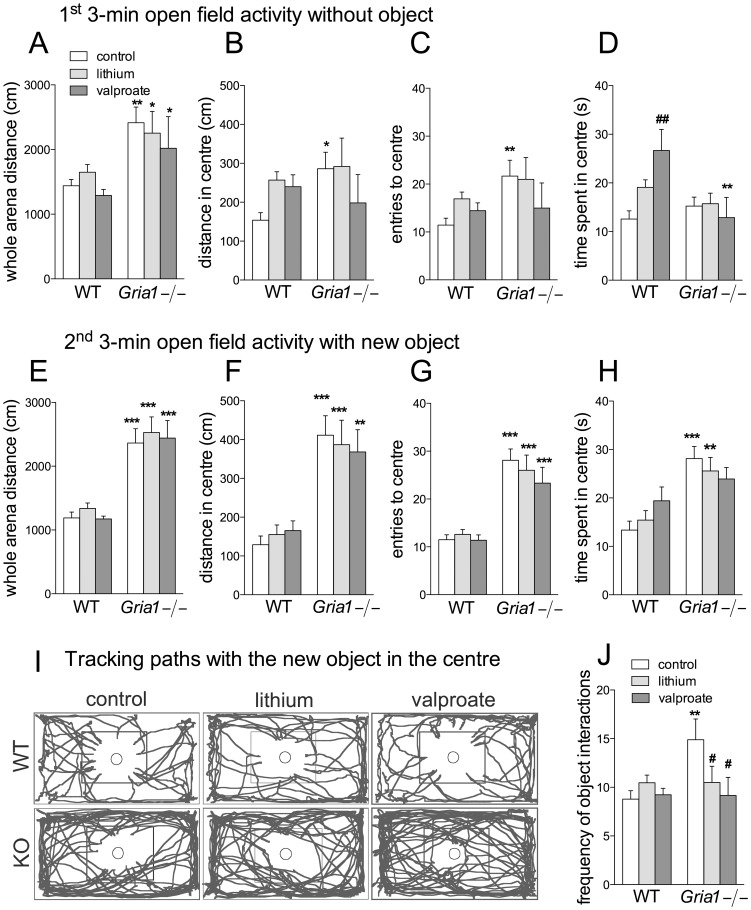
Figure 4. Effects of chronic drug treatments on open field activity and interaction with a novel object.
Distance travelled in the whole arena (A, E) and in the centre (B, F), entries to the centre (C, G) and time spent in the centre (D, H) during the first 3 min before the object was introduced (A–D) and during the next 3 min when a novel object was located in the centre of arena (E–H). (I) Representative tracking paths for Gria1−/− and WT mice during the 2nd 3-min period with an object, with a square in the centre delineating visual centre of arena. (J) Frequencies of object interactions, scored using Ethograph software. Data are means ± SEM (n = 6–15). *p<0.05, **p<0.01, ***p<0.001 for the differences between genotypes after the same treatment; # p<0.05, ## p<0.01 for the differences from the control within the same genotype (two-way ANOVA followed by Bonferroni post-hoc test).

