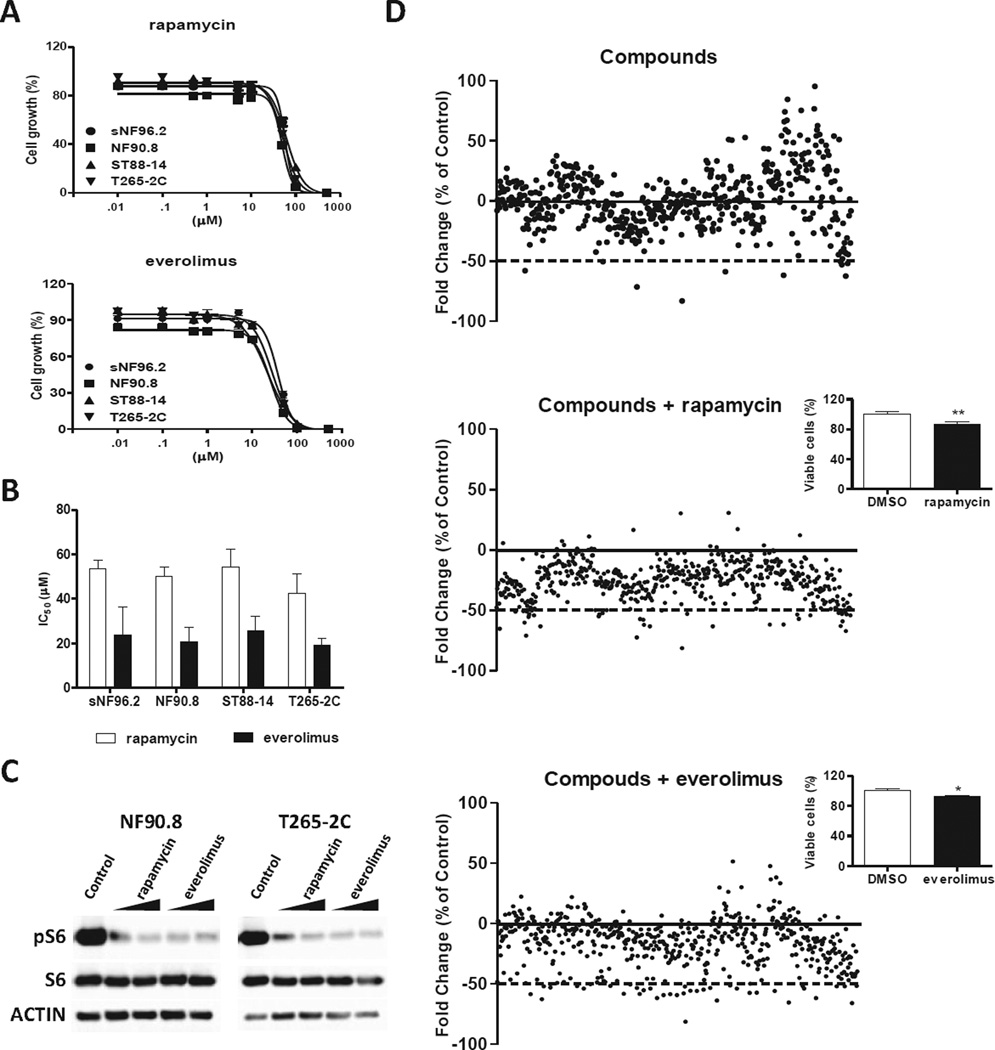
Figure 1. Cell-based drug screening assay identifies compounds with anti-proliferative effect in combination with mTOR inhibitors.
(A) MPNST cells were treated with nine different concentrations of rapamycin or everolimus (10 nM to 500 µM) and proliferation was analyzed by alamarBlue assay 72 hours after drug exposure. (B) IC50 values at 72 hours of four MPNST cell lines treated with rapamycin and everolimus. Data are represented as average ± standard deviation of four independent experiments with each containing three replicates. (C) NF90.8 and T265-2C cells were treated with rapamycin at 25% and 12.5% of IC50 values (12.5 µM and 6.2 µM for NF90.8 and 10 µM and 5 µM for T265-2C, respectively) or everolimus (5 µM and 2.5 µM for both MPNST cells); after 48 hours of drug exposure total protein lysates cells were separated by SDS-PAGE and analyzed by Western blot for pS6, total S6, and ACTIN. (D) Cell-based screening of drug libraries was performed in independent experiments, testing the libraries alone (upper plot) or the libraries in combination with rapamycin (middle plot) or everolimus (lower plot) at 25% of IC50 (12.5 µM and 5 µM, respectively) in NF90.8 cells. Each dot represents the cell proliferation change of individual compounds. Data represented as fold change vs. control group (DMSO). Insets show the effect of mTOR inhibitors as a single agent in cell proliferation.

