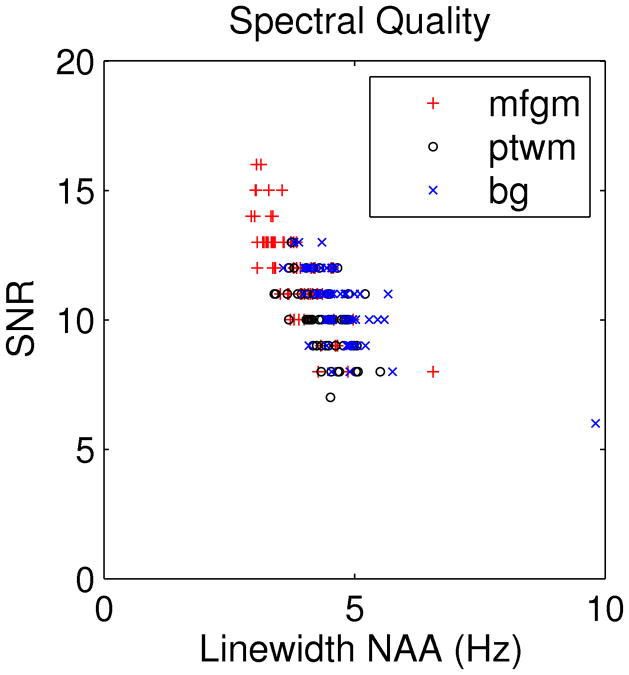
Figure 2.
Spectral quality plot showing the association of poorer SNR with increased linewidth. mfgm: medial frontal grey matter, ptwm: peritrigonal white matter, bg: basal ganglia. Note the bg outlier at 9.8 Hz corresponds to a voxel reported in Figure 7 that overlapped the ventricle.

