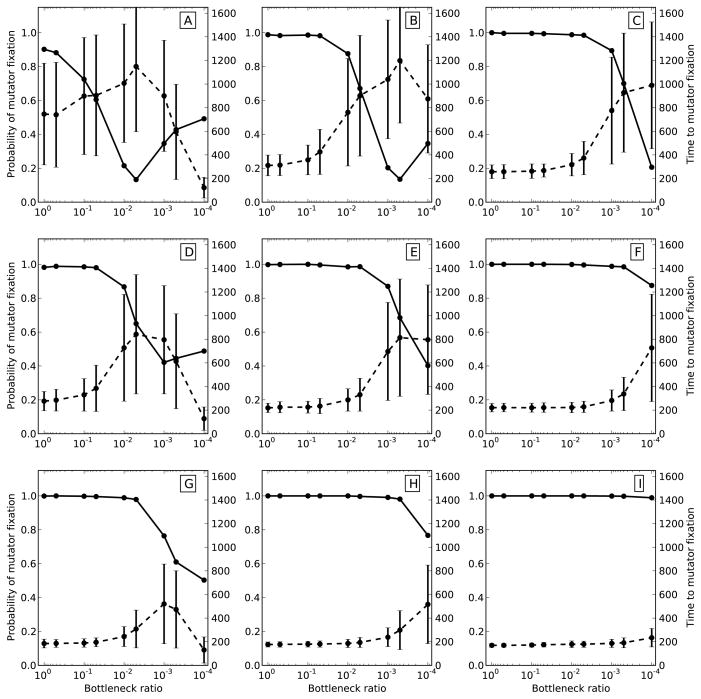
Figure 3. Mutator strength and population bottlenecks.
Relative fixation probabilities (circles) were calculated as the observed fixation probability over the fixation probability in a non-bottlenecked simulation. Relative average times to fixation (squares) were calculated as the observed average fixation time minus the average fixation time in a non-bottlenecked population. Relative fixation probability of a weaker 5-fold mutator (dashed) was generally lower and declined faster than that of a stronger 50-fold mutator (solid). Relative time to fixation of the 5-fold mutator (dashed) was generally greater than that of the 50-fold mutator and increased faster with smaller bottlenecks. All populations were propagated at N = 106, while Ub varied between 10−6 (A), 10−7 (B), and 10−8 (C). Results are averaged over 1000 runs of the simulation.

