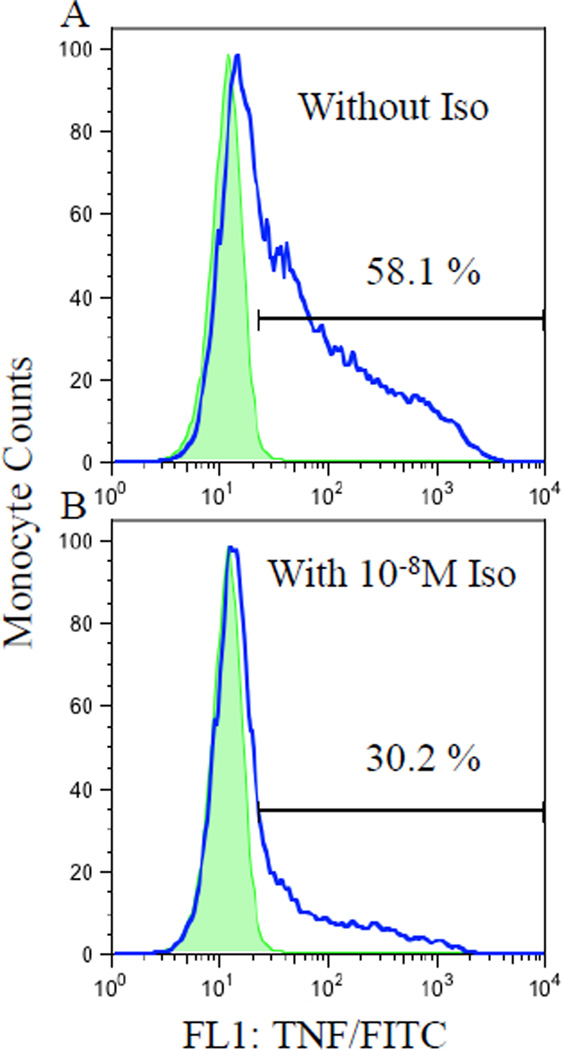
Fig.1.
Flow cytometry histograms of LPS-stimulated intracellular TNF expression by monocytes from a representative subject without (A) and with (B) 10−8 M Iso stimulation in the absence (shaded peaks; as a negative control) and presence (clear peaks) of anti-TNF/FITC antibody. The numbers represent the % TNF-expressing monocytes of total monocytes, showing suppression of TNF production by Iso.

