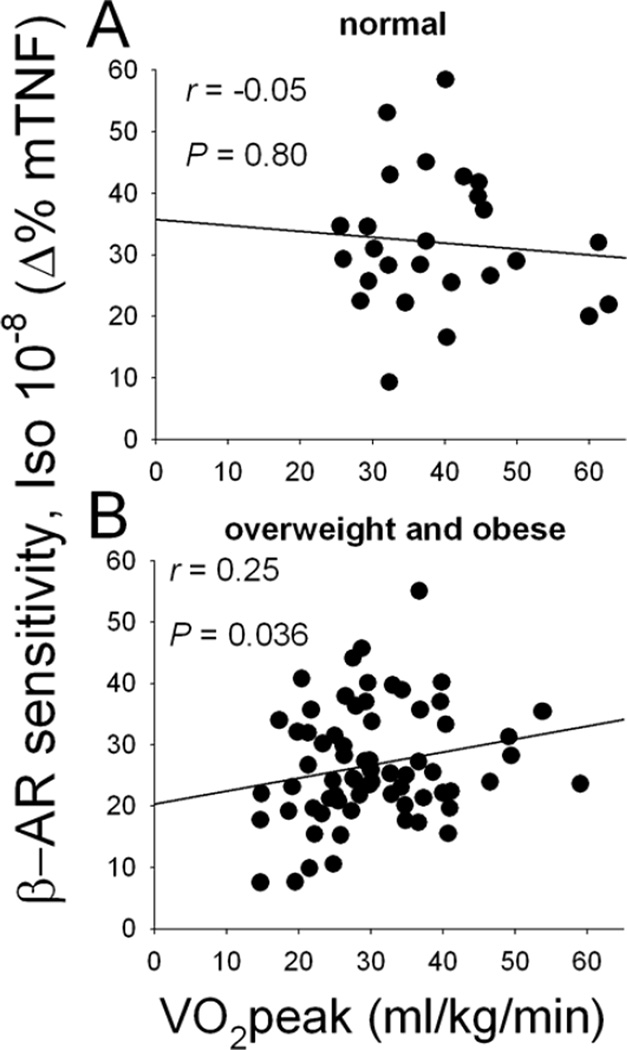
Fig.3.
Scatterplots showing the correlation between physical fitness (VO2peak) and β-AR sensitivity (measured as inhibition of monocytic TNF (mTNF) production by 10−8 M Iso) in normal-weight (A) vs. overweight or obese (B) individuals. Correlation coefficients and significance are computed from the log-transformed data of VO2peak, while the raw data are presented in the graph.

