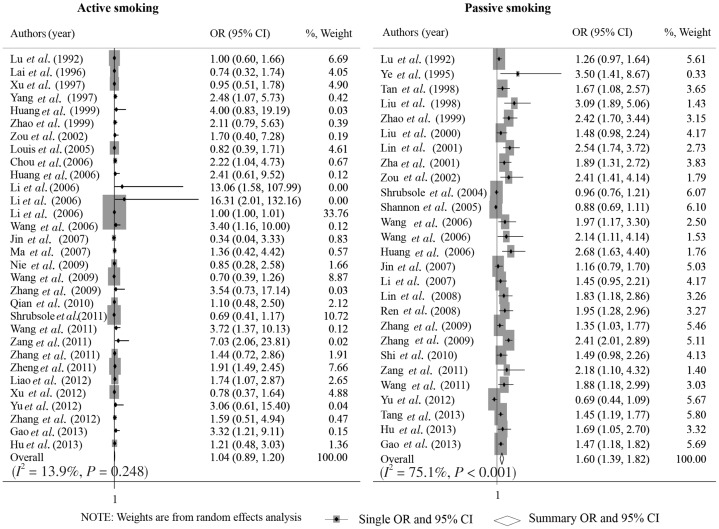
Figure 1. Forest graph on the association of active and passive smoking with breast cancer risk.
Each row in the forest graph represents the original odds ratio (OR) with 95% confidence interval (CI) reported in one study. And the last row represents the overall association of active and passive smoking with breast cancer risk.

