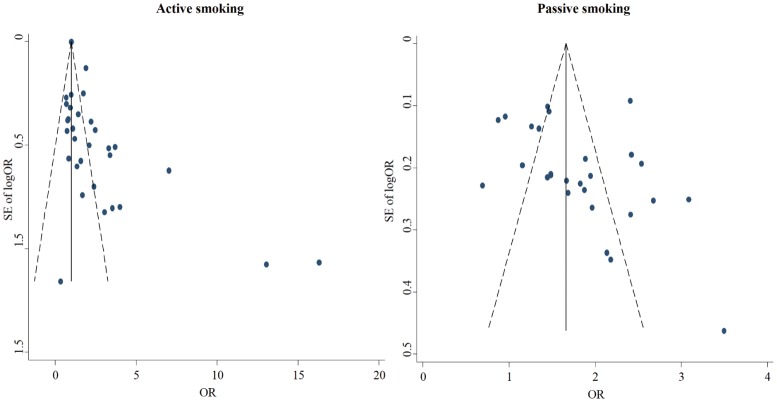
Figure 2. Funnel plots on the association of active and passive smoking with breast cancer risk.
Each plot represents the original OR against its standard error of OR reported in one included study. The full line in the middle and the imaginary lines in the two sides represent the overall OR with 95% CI.

