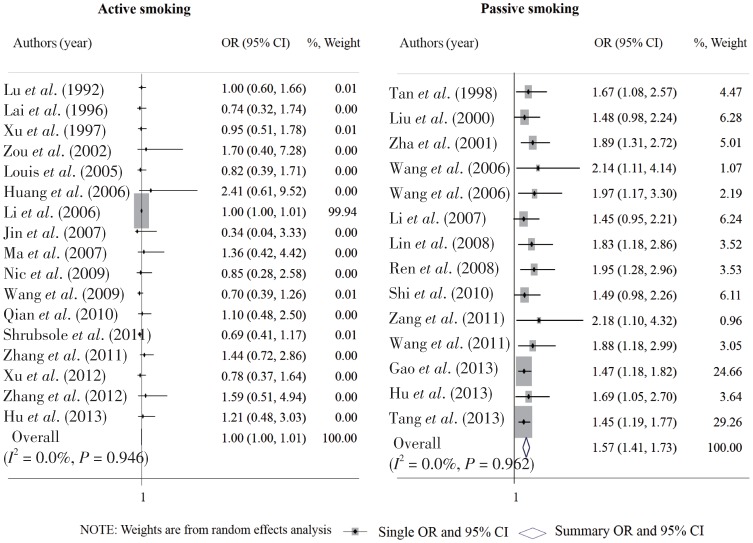
Figure 5. Sensitivity analysis after excluding studies that fell outside of the funnel plots in the primary meta-analysis on the association of active and passive smoking with breast cancer risk.
Each row in the forest graph represents the original OR with 95% CI reported in one study. The diamond in the last row represents the overall OR with 95% CI.

