
Figure 4.
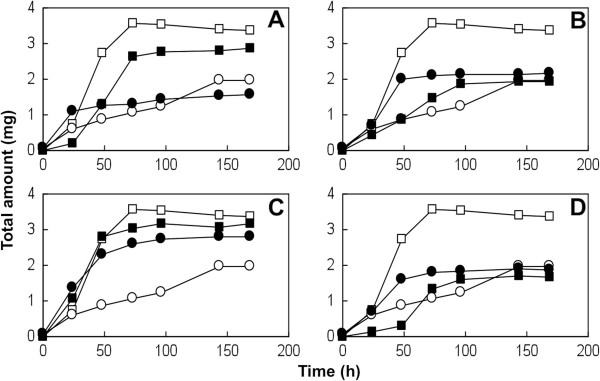
PP1Y growth, measured as total protein and total carbohydrate content in the culture medium, in the presence of millimolar concentrations of heavy metals. (A) 2.5 mM NiCl2; (B) 10 mM PbCl2; (C) 10 mM CuCl2; (D) 5 mM ZnCl2. The control growth shown in all graphs was performed in 1% glutamic acid. Empty squares and circles: total proteins and total carbohydrates, respectively in the control culture. Filled squares and circles: total proteins and total carbohydrates, respectively in the cultures containing metals. Error bars are omitted for clarity; relative error was invariably lower than 8%.