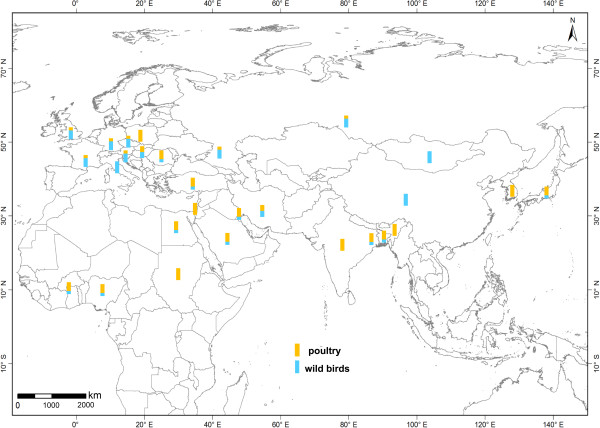
Figure 4.

Spatial distribution of infected wild birds and poultry along four transmission routes. Isolates from wild birds and poultry are shown respectively in blue and yellow bars, with bar height representing proportion of isolates in the hosts of wild birds and poultry.
