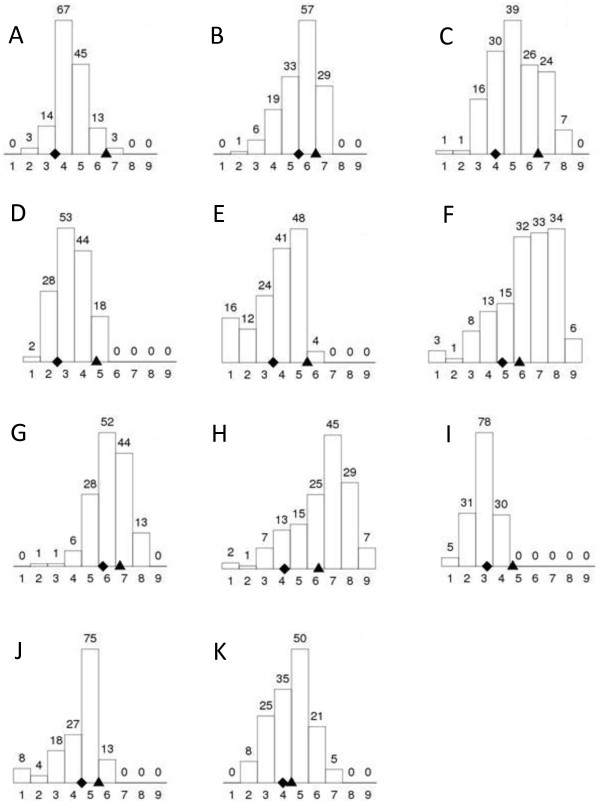
Figure 1.

Distribution of average GLS disease scores in the 145 RILs of the CML444 X SC Malawi population in each of the environments. The GLS disease scores on a 1-9 scale from resistant to susceptible are shown on the x-axis, and the number of RILs with each disease score is plotted on the y-axis and written above each column. The GLS disease scores for CML444 (♦) and SC Malawi (▲) are shown on the x-axis. The environments were: A-C, Redgates 2008, 2009, 2010, respectively; D-F, Ukalinga 2008 (planted 29 Nov 2007), Ukalinga 2008 (planted 19 Dec 2007), Ukalinga 2009, respectively; G, Hildesheim 2009; H-I, Baynesfield 2009, 2010, respectively; J-K Cedara 2008, 2009, respectively.
