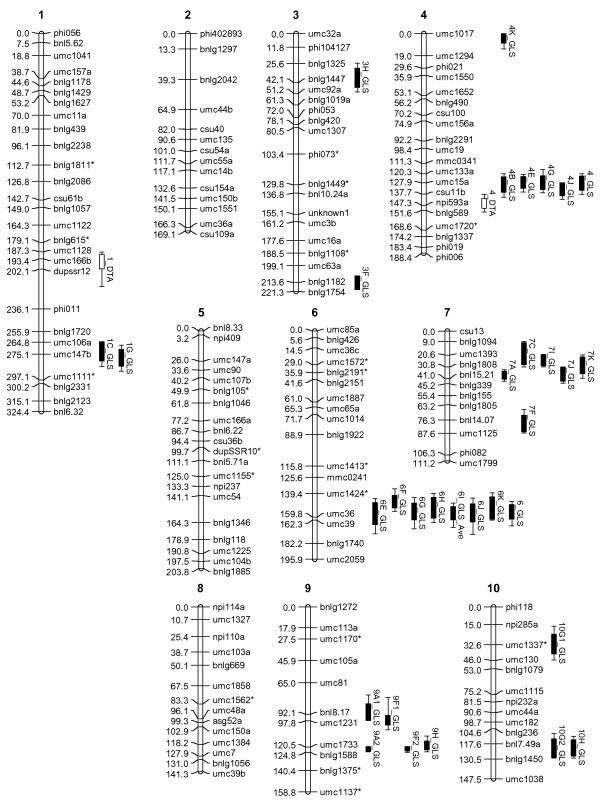
Figure 2.

Q-Map 2.0 - Genetic linkage map (167 markers) from the RIL population (n = 145) derived from the parental lines CML 444 and SC Malawi. Each marker position (cM) and marker name are shown on the left and right of each chromosome, respectively. Markers added to the map obtained from Messmer et al.[33] are indicated by *. QTL for days to anthesis (white bars), GLS resistance per field trial (black bars) and joint QTL for GLS resistance (cross hatch bars) are shown on the right of relevant chromosomes (1-LOD intervals i.e. 95% confidence intervals). The 2-LOD intervals (99% confidence intervals) for each QTL are indicated by lines on each side of the 1-LOD intervals.
