. 2014 May 27;3:e02730. doi: 10.7554/eLife.02730

Figure 3. Neurotransmitters of the eye circuit.

(A) Cell body positions of eye circuit neurons relative to the larval axonal scaffold and five large gland cells. Motorneurons are numbered according to the cell identifiers. (B and C) Surface representation of the average expression domains of neurotransmitter marker genes relative to the larval axonal scaffold. The following genes are shown: (B) histaminergic marker histidine decarboxylase (hdc; green), serotonergic marker tryptophan hydroxylase (TrpH; red), dopaminergic marker tyrosine hydroxylase (TyrH; yellow), adrenergic marker dopamine beta hydroxylase (dbh; cyan), (C) glutamatergic marker vesicular glutamate transporter (VGluT; red), cholinergic marker choline acetyltransferase (ChAT; grey), GABAergic marker glutamate decarboxylase (gad; green). The axonal scaffold, based on average acetylated-tubulin signal, is shown in grey. PRC, photoreceptor; cPRC, ciliary photoreceptor; IN, interneuron; MN, motorneuron. In (B) dashed ovals mark the position of the eyespots. Black arrows show the ring formed by the circumesophageal connectives.

DOI: http://dx.doi.org/10.7554/eLife.02730.020

Figure 3.

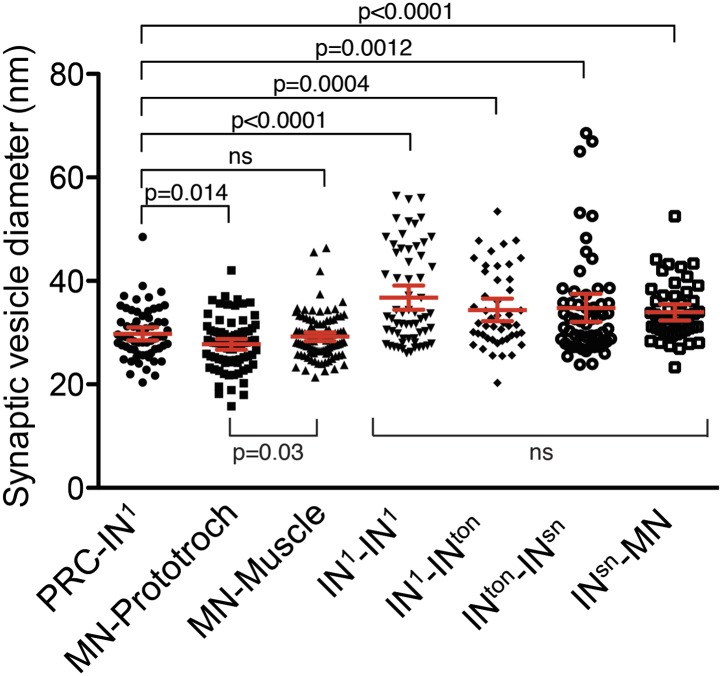
Figure 3—figure supplement 1. Synaptic vesicle diameter for different synapse types.

Figure 3—figure supplement 1.

Scatter plot of the diameter of synaptic vesicles of different synapse types. The labels indicate the pre- and post-synaptic neurons. Vesicle diameter was measured from high-resolution (0.2 nm/pixel) images. Mean with 95% confidence interval are shown. n >47 vesicles for each synapse type. p-values of an unpaired t test with Welch's correction are indicated relative to synaptic vesicles of the photoreceptors.
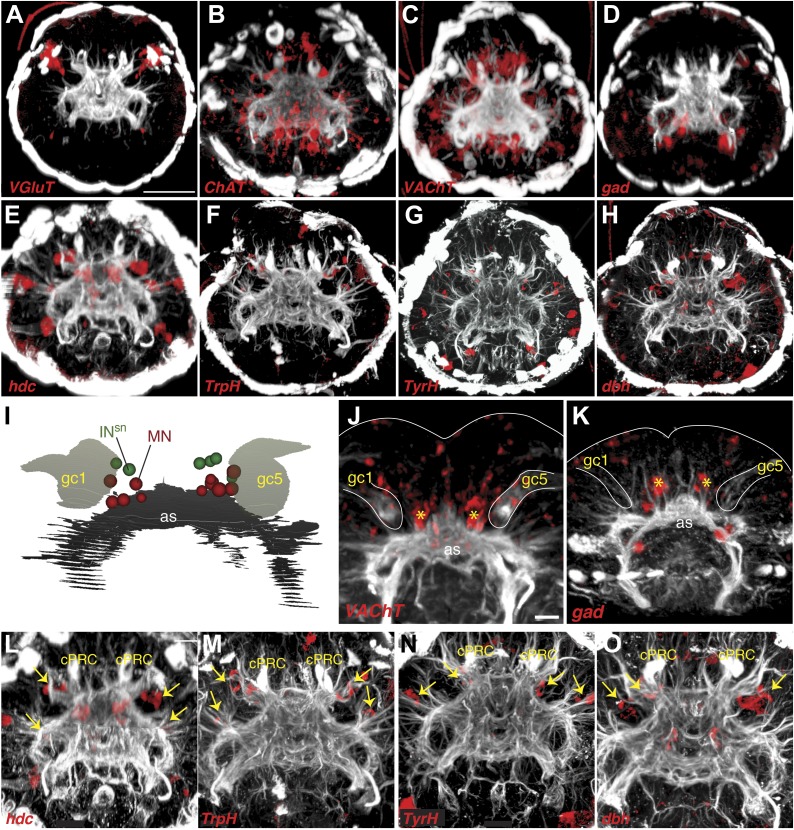
Figure 3—figure supplement 2. Expression of neurotransmitter markers in the head of Platynereis larva.

Figure 3—figure supplement 2.

(AH) Whole mount RNA in situ hybridization in 3-day-old larvae for neurotransmitter marker genes (red), counterstained with acetylated tubulin antibody (white). (A) Glutamatergic marker vesicular glutamate transporter (VGluT), (B and C) cholinergic markers choline acetyltransferase (ChAT) and vesicular acetylcholine transporter (VAChT), (D) GABAergic marker glutamate decarboxylase (gad), (E) histaminergic marker histidine decarboxylase (hdc), (F) serotonergic marker tryptophan hydroxylase (TrpH), (G) dopaminergic marker tyrosine hydroxylase (TyrH), and (H) adrenergic marker dopamine beta hydroxylase (dbh). (I) Ventral view schematic based on EM data of cell body positions of motorneurons (MN) and Schnörkel interneurons (INsn) relative to the larval axonal scaffold (as) and two gland cells (gc1, gc5). (J and K) Close-up of whole mount RNA in situ hybridization of (J) cholinergic marker VAChT and (K) GABAergic marker gad. Gland cells (gc) are indicated by a white outline. Yellow asterisks mark the ventral domain of gene expression. (LO) Close-up of panels (EH) showing whole mount RNA in situ hybridizations of (L) hdc (M) TrpH (N) TyrH (O) dbh. Yellow arrows indicate areas of gene expression in the region of the interneurons. The sensory cilia of the ciliary photoreceptor cells (cPRC) are indicated. (AH and LO) are anterior views, (IK) are ventral views. Scale bar: (AH) 50 µM, (JO) 10 µM.
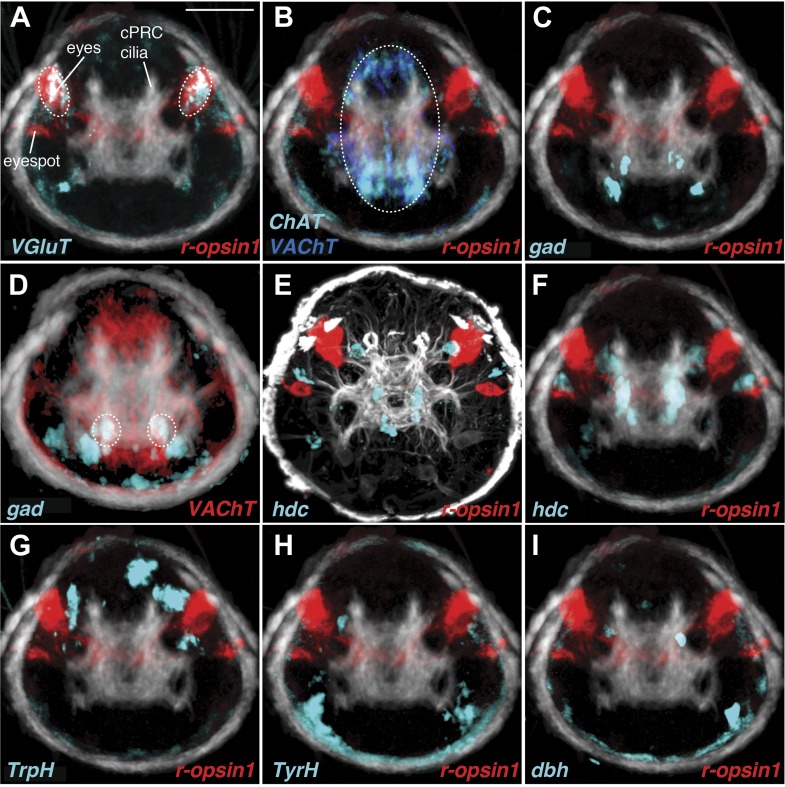
Figure 3—figure supplement 3. Neurotransmitter marker gene expression profiling.

Figure 3—figure supplement 3.

The spatial relationships and colocalization of neurotransmitter marker genes were characterized by image registration and double RNA in situ hybridization in 3-day-old Platynereis larvae. (AD and FI) Average expression patterns of neurotransmitter marker genes and r-opsin1 projected onto a common whole-body nuclear reference template. An average acetylated tubulin signal (white) was also projected onto the reference. Colocalization of registered genes in the average gene expression 3D image stacks is indicated by white and highlighted by dashed circles. (E) Double whole mount RNA in situ hybridization for hdc (cyan) and r-opsin-1 (red) counterstained with acetylated tubulin antibody (white). All images are anterior views. Scale bar 50 µM. Average 3D image stacks are available in Randel et al. (2014).