. 2014 May 27;3:e02730. doi: 10.7554/eLife.02730

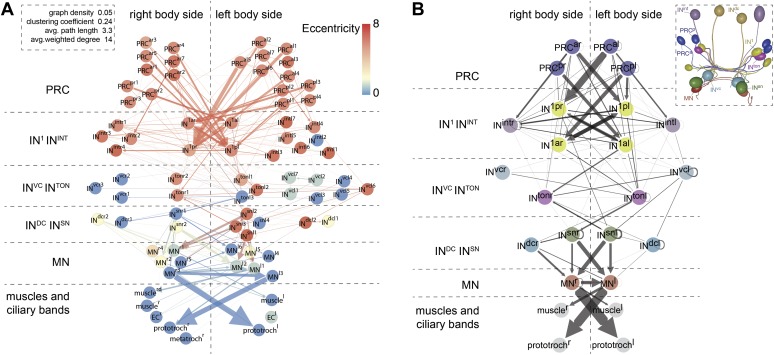
Figure 4. Network analysis of the visual eye circuitry.

(A) Full connectomic graph of the visual eye circuit including 71 neurons and 8 effectors (muscles, ciliary band cells and epithelial cells). The edges are directed from presynaptic cell pointing to postsynaptic cells. Edges are weighted by the number of synapses. Inset shows selected network parameters. (B) Merged graph representation of the visual circuit. Nodes correspond to neuron classes, edges are weighted by the maximum number of synapses between two neuron types of each class. Nodes are colored following the color scheme used to label cell types. Inset shows the anatomical position of the cell types. PRCal, anterior-left photoreceptors; PRCar, anterior-right photoreceptors; PRCpl, posterior-left photoreceptors; PRCpr, posterior-right photoreceptors; IN, interneuron; MN, motorneuron. Matrix files of the complete and the merged networks are available in Figure 4—source datas 1 and 2.

DOI: http://dx.doi.org/10.7554/eLife.02730.024

Figure 4—source data 1.
All-against-all connectivity matrix of the Platynereis eye circuit.
elife02730s001.csv (14KB, csv)
DOI: 10.7554/eLife.02730.025
Figure 4—source data 2.
Grouped connectivity matrix of the Platynereis eye circuit.
elife02730s002.csv (2.1KB, csv)
DOI: 10.7554/eLife.02730.026

Figure 4.

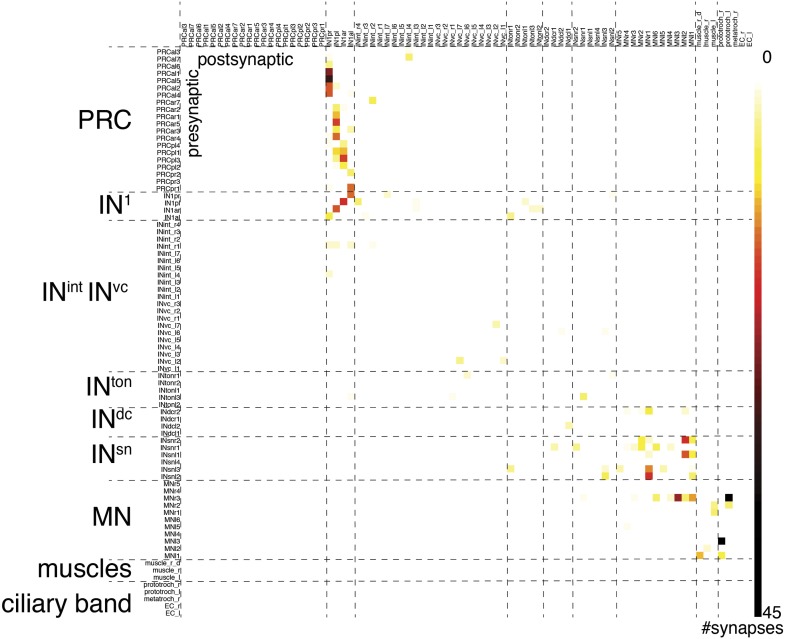
Figure 4—figure supplement 1. Synaptic connectivity matrix of the Platynereis larval visual circuit.

Figure 4—figure supplement 1.

The synaptic connectivity matrix represents synaptic connections between 71 neurons and 8 effectors.
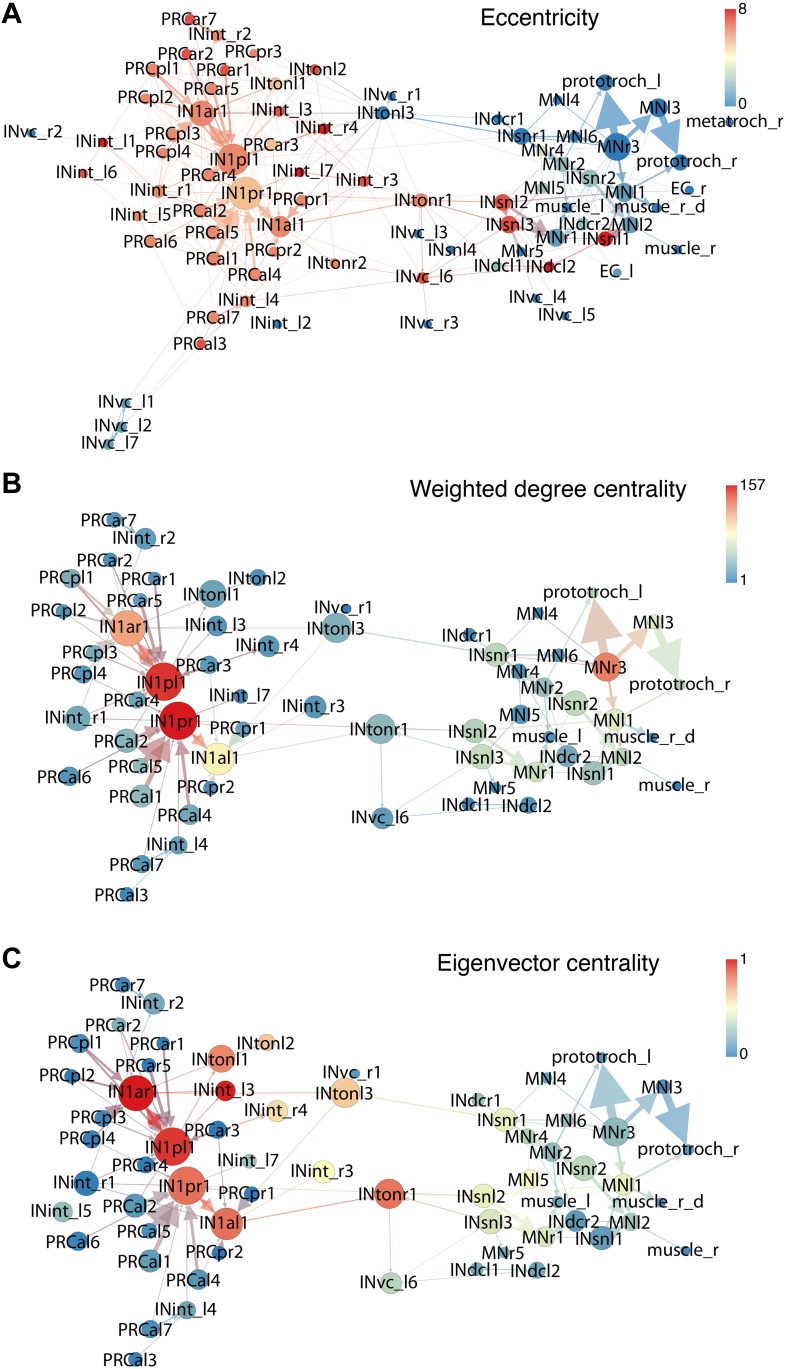
Figure 4—figure supplement 2. Connectivity graphs of the Platynereis larval visual circuit.

Figure 4—figure supplement 2.

Nodes correspond to single neurons, edges represent connections, weighted by synapse number. The layout is based on force field clustering. Nodes in the full (A) or the trimmed (B and C) graphs were colored by eccentricity (A), weighted degree centrality (B) or eigenvector centrality (C). In (A) all cells and connections of the minimal eye circuit are shown, in (B and C) cells connected with <3 synapses and edges <3 synapses were removed.
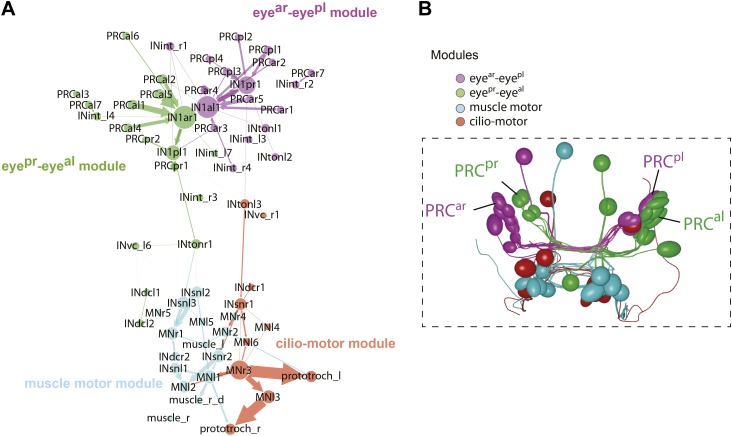
Figure 4—figure supplement 3. Modules in the eye connectivity graph.

Figure 4—figure supplement 3.

(A) Trimmed connectomic graph of the visual eye circuit including 56 neurons and 5 effectors (muscles and ciliary band cells). Colors indicate the four modules of the network. Edges are colored as their source node. (B) Anatomical position of the cells of the four modules. The cells are colored as in (A), according to their module association.
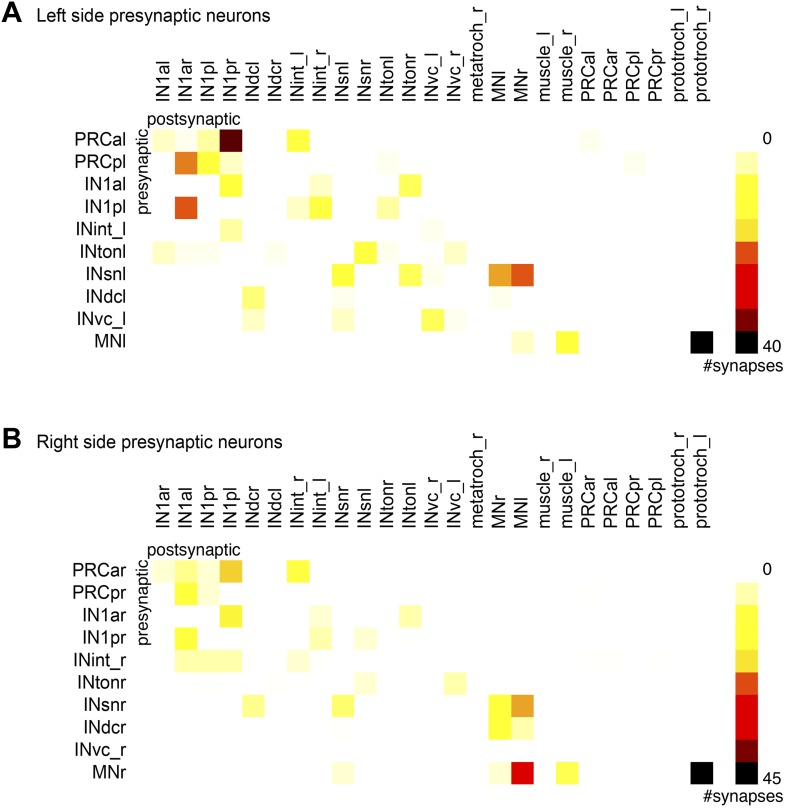
Figure 4—figure supplement 4. Connectivity matrix of the left and right body sides.

Figure 4—figure supplement 4.

Synaptic connectivity matrix of cells with a cell body on the left (A) and right (B) body side.
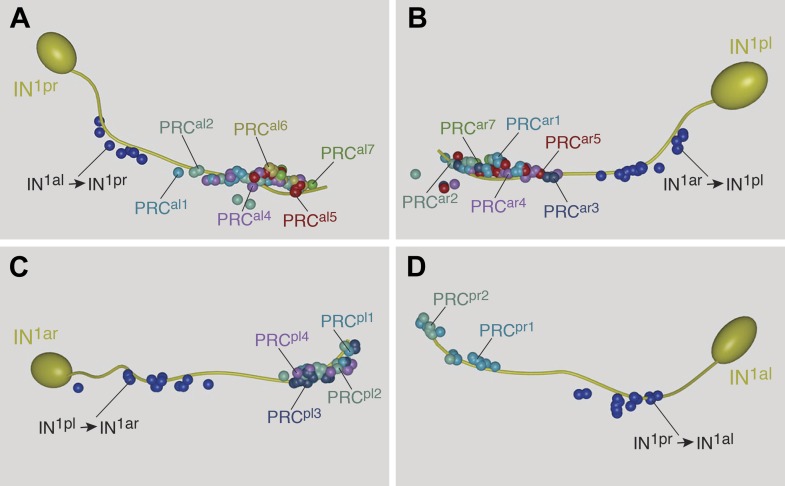
Figure 4—figure supplement 5. Stereotypy of synapse distribution on IN1 cells.

Figure 4—figure supplement 5.

Spatial distribution of synapses onto axons of the posterior right (A), posterior left (B), anterior right (C), and anterior left (D) IN1 axons. Synapses of individual PRCs to IN1 axons are shown in different colors. The cell-body proximal synapses from the axons of the respective crosswise IN1 cell are also shown.
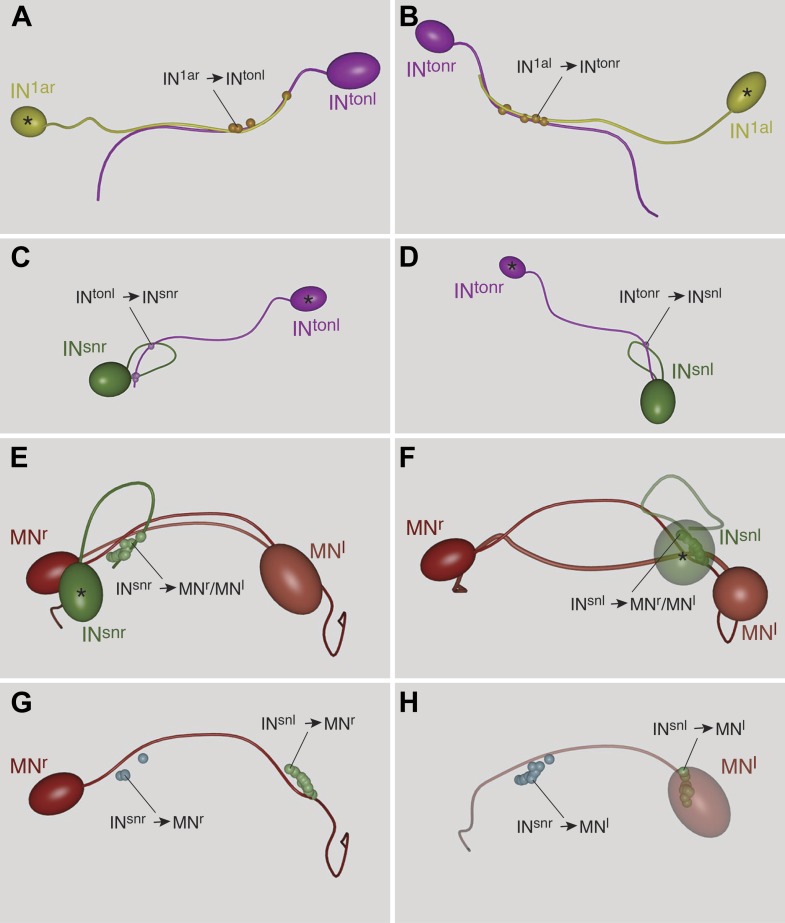
Figure 4—figure supplement 6. Stereotypy of synapse distribution on INton, INsn and MN cells.

Figure 4—figure supplement 6.

Spatial distribution of synapses between (A and B) IN1 and INton, (C and D) INton and INsn and (EH) INsn and MN cells. Asterisks mark the presynaptic neuron.