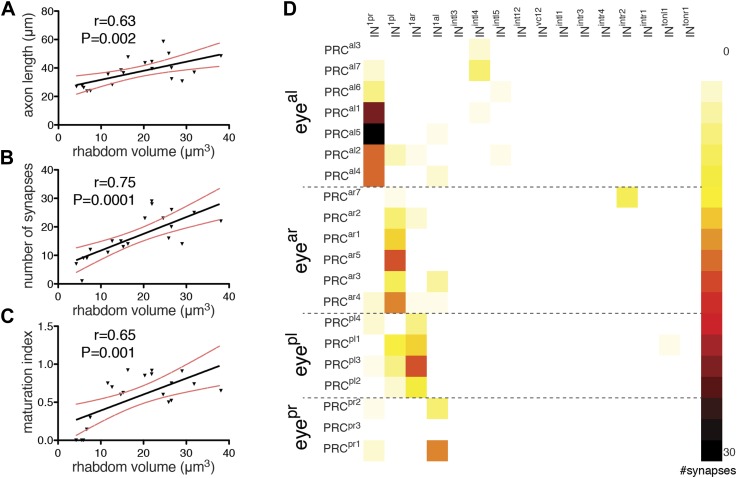
Figure 5. Maturation of photoreceptor connections.
(A) Relationship of rhabdom volume to photoreceptor axon length. (B) Relationship of rhabdom volume to photoreceptor synapse number. (C) Relationship of photoreceptor connectivity-maturation index to rhabdom volume. In A–C the black line shows linear regression with 95% confidence interval (red dashed lines). Pearson r and p-value are shown. (D) Connectivity matrix of the photoreceptors. The matrix is ordered from top to bottom by eye and then for each eye by photoreceptor rhabdom size increasing from top to bottom. Eyeal, anterior-left eye; eyear, anterior-right eye; eyepl, posterior-left eye; eyepr, posterior-right eye.

