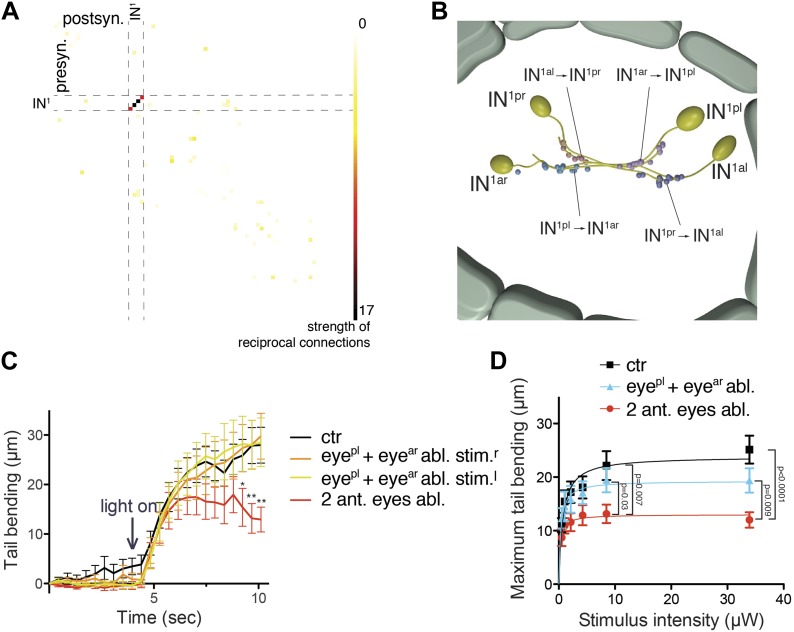
Figure 7. An interneuron motif for enhanced contrast detection.
(A) Strength of reciprocal connections between all neuron pairs in the complete visual circuit. The strength of reciprocal connections was defined as the geometric mean of the number of reciprocal synapses between each neuron pair. The single neuron identifiers are not shown for simplicity. (B) The strongest reciprocal motif in the eye circuit is between the crosswise IN1 pairs. The position and polarity of the synapses are indicated. (C) Quantification of tail bending in different eye ablated larvae under selective eye illumination with a 488-nm laser. Data are shown as mean ± SEM, n >17 for each condition. Larvae lacking two anterior eyes were compared to non-ablated control larvae at each time point (*p value<0.05, **p value<0.01, unpaired t test). (D) Signal-response curve of maximum tail bending upon selective eye illumination in immobilized larvae using 488-nm stimuli of different intensities. The data are fitted with a saturation-binding curve. Data are shown as mean ± SEM, n >24 larvae for each condition (independent from C). p-values of unpaired t tests comparing larvae lacking two anterior eyes to the other conditions are shown. Source bending data from (C and D) are shown in Figure 7—source data 1 and Figure 7—source data 2.
DOI: http://dx.doi.org/10.7554/eLife.02730.040

