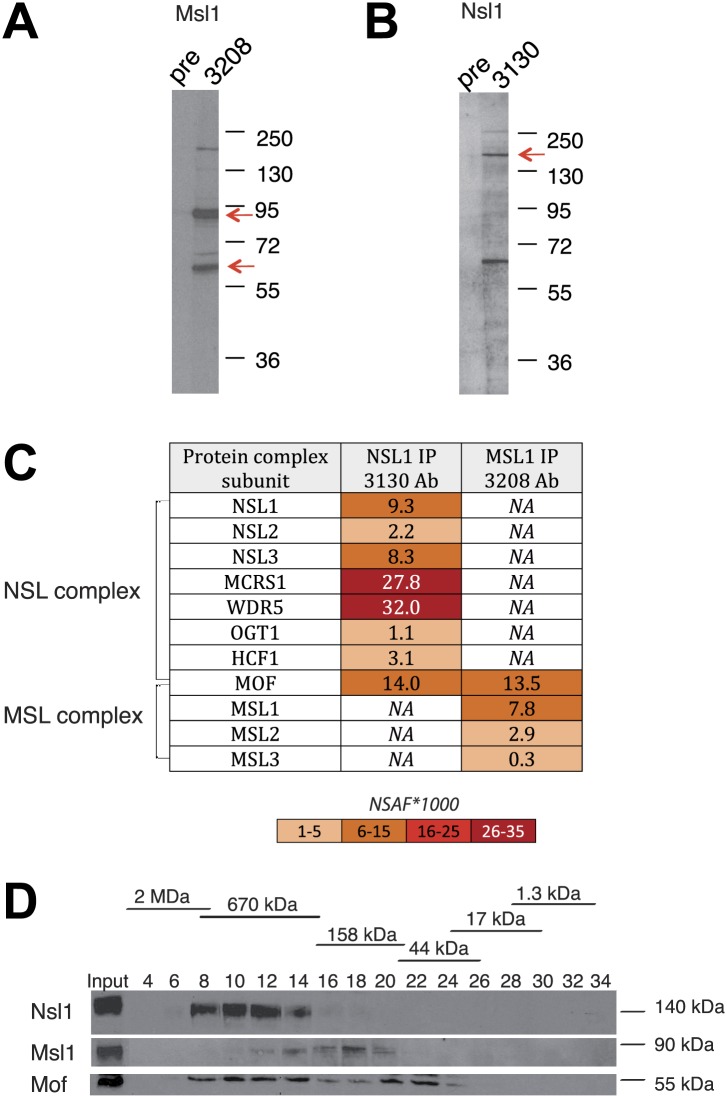
Figure 1. Msl1 and Nsl1 incorporate into endogenous complexes in mESCs.
(A and B) Western Blot analysis using the raised anti-Msl1 (3208) or anti-Nsl1 (3130) antibodies on nuclear extracts. Preimmune sera (pre) were used as negative controls. (C) Anti-Msl1 (3208) or anti-Nsl1 (3130) antibodies were used to immunoprecipitate protein complexes from mESC nuclear extracts. The IP-ed complexes were then analysed by multidimensional protein identification technology (MudPIT). The identified MSL- or NSL-containing complex proteins and their relative protein abundance in the samples are represented by normalized spectral abundance factor (NSAF) (Zybailov et al., 2006). NSAF allows the comparison of abundance of individual proteins in multiple independent samples and in multiprotein complexes (Florens et al., 2006; Paoletti et al., 2006). The colour intensity reflects of the NSAF values multiplied by 1000 (as indicated). (D) Gel filtration of mESC nuclear extracts. Every second fraction eluted from a Superose 6 column was analysed for the presence of Nsl1, Msl1, and Mof by Western Blot. Molecular weight markers for the corresponding fractions are indicated on the top of the panel.
DOI: http://dx.doi.org/10.7554/eLife.02104.003

