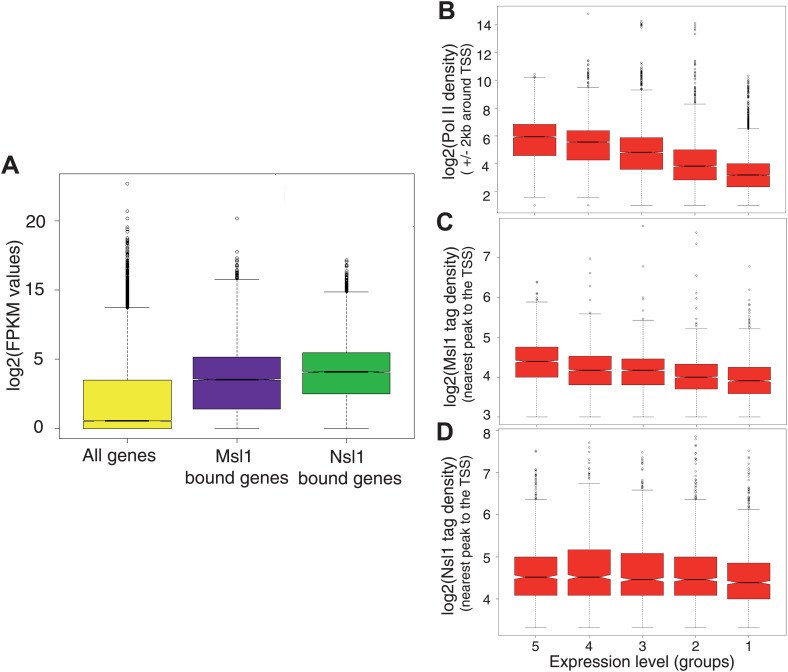
Figure 3. Msl1 and Nsl1 bind to active genes, but participate differentially to gene expression.
(A) Boxplots showing the log2 of RNA FPKM expression values from mESCs of all analysed, Msl1-, or Nsl1-bound ENSEMBL genes. (B, C and D) RNA expression values are ranked into five groups, where group 5 represents the highest RNA expression level and group 1 the lowest (see bottom of panels B–D). Boxplots show the tag density of the nearest peak to the TSS for (B) Pol II, (C) Msl1 and (D) Nsl1 tag densities around the TSSs at the five groups. Only density values higher than zero were taken into consideration. The median is different between groups, if the notches of the boxplots do not overlap.

