. 2014 Jun 4;3:e02104. doi: 10.7554/eLife.02104

Figure 5. MSL and NSL bind to shared and specific gene sets.

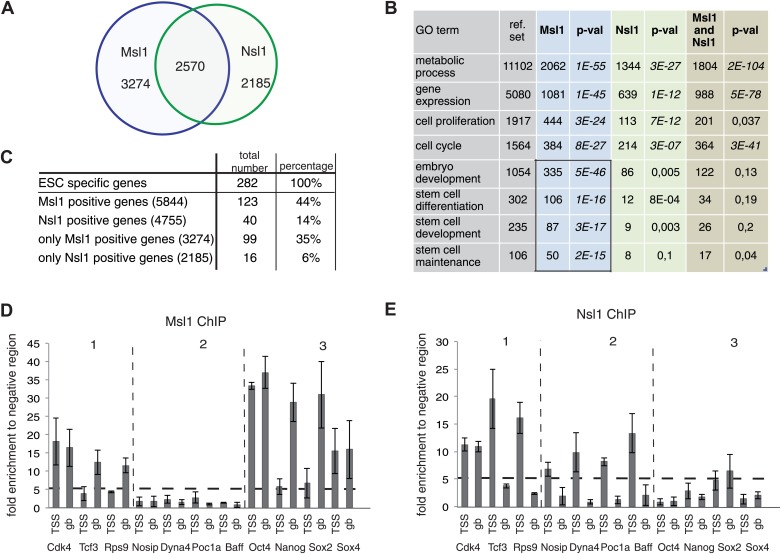
(A) Venn Diagram showing the overlap between Msl1 and Nsl1 binding sites at ENSEMBL genes. For statistical analyses see Figure 5—figure supplement 1A–C. Binding at TSSs and gene bodies was considered together. Genes are listed in Figure 2—source data 2. (B) Gene ontology analysis using Manteia (Tassy and Pourquie, 2013) of only Msl1 binding sites, only Nsl1 binding sites, or common binding sites. Significant GO terms for only Msl1 binding sites are highlighted by a box. (C) Differentially expressed genes were identified with the DEseq analysis (Anders and Huber, 2010). The table represents genes expressed only in mESCs (when compared to NPCs). The overlap with all Msl1 positive, all Nsl1 positive or only complex specific genes was calculated. Statistical analyses in Figure 5—figure supplement 2A–D indicates significant enrichment of Msl1 at mESC-specific genes. (D and E) Bound genes were divided into three categories: Common (category 1), specific for Nsl1 (category 2) and specific for Msl1 (category 3). From these categories genes were chosen for ChIP-qPCR using the anti-Msl1 (D) or anti-Nsl1 (E) antibodies. Fold enrichment higher than five was defined as specific binding and Msl1 and Nsl1 presence was analysed at the indicated genes in each category. Bar charts represent the mean and standard deviation of 2–3 independent experiments.

DOI: http://dx.doi.org/10.7554/eLife.02104.012

Figure 5.

Figure 5—figure supplement 1. MSL and NSL significantly bind to shared and specific gene sets.

Figure 5—figure supplement 1.

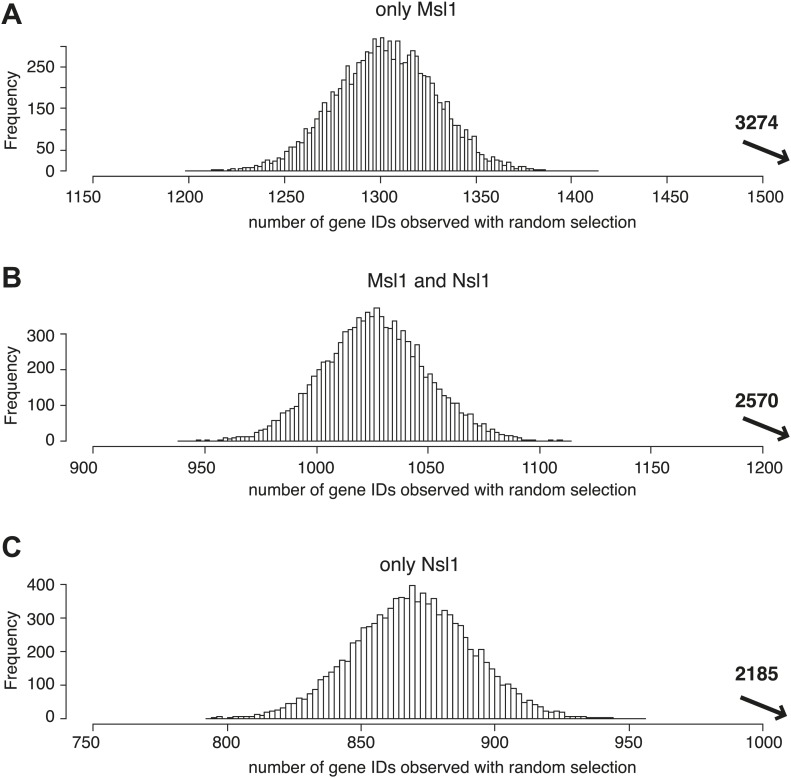
(AC) Bootstrap statistical analyses (‘Materials and methods’) were carried out with a random selection of 10,600 genes (IDs) out of a total pool of 26,460 ENSEMBL IDs. Histograms represent the average numbers of observed IDs in the three random sets. The average numbers and SDs are: only Msl1 1303 ± 27 (A), Msl1 and Nsl1 1027 ± 23 (B) and for only Nsl1 870 ± 22 (C). These averages are significantly far from the experimentally determined numbers (p-value<1.0e−90) shown with an arrow in bold. The z-cores are 75 (only Msl1), 66 (Msl1 and Nsl1) and 60 (Nsl1).
Figure 5—figure supplement 2. MSL, but not NSL locates to mESC-specific genes.

Figure 5—figure supplement 2.

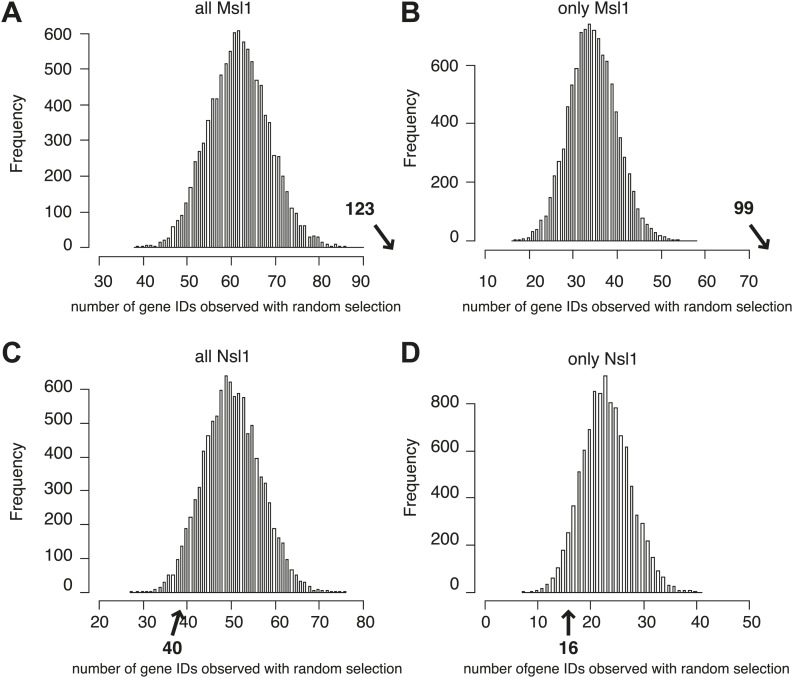
(AD) Bootstrap statistical analyses (‘Materials and methods’) were carried out with a random selection of 282 genes (IDs) out of a total pool of 26,460 ENSEMBL IDs. Histograms represent the average numbers of observed IDs in the four random sets. The average numbers and SDs are: 62 ± 7 (all MSL) (A), 35 ± 6 (only MSL) (B), 51 ± 7 (all NSL) (C) and 23 ± 5 (only NSL) (D). The averages obtained by random selection are significantly far from those obtained experimentally (shown with an arrow in bold) for MSL (A and B): p-value=3.27e−18 (all MSL) and 1.11e−31 (only MSL). However, the averages are not significantly different (shown with an arrow in bold) for NSL (C and D): p-value=0.107 (all NSL) and p-value=0.1177 (only NSL).