. 2014 Jun 4;3:e02104. doi: 10.7554/eLife.02104

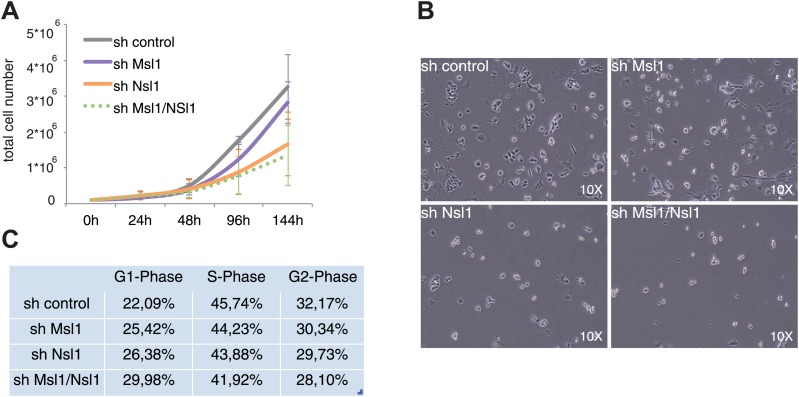
Figure 6. NSL influences cell growth and cell cycle of mESCs.

(A) Cell proliferation analyses by cell counting over 6 days of control, or indicated KD mESCs. Error bars represent the standard deviation of three independent experiments. See Figure 6—figure supplement 1A for validation of KD efficiency of sh Msl1/Nsl1 double KD mESCs. (B) Morphology of control and Msl1 and Nsl1 single or double KD mESCs at 6 days after lentiviral infection using a reverse-phase microscope with a 10x magnification. (C) Cell cycle analyses of control and KD mESCs by propidium iodide staining followed by FACS analyses. Cell numbers of G1-, S- or G2-phases are represented in percentages after analyses with CellQuest Pro software. See Figure 6—figure supplement 1B for apoptosis analysis.

DOI: http://dx.doi.org/10.7554/eLife.02104.015

Figure 6.

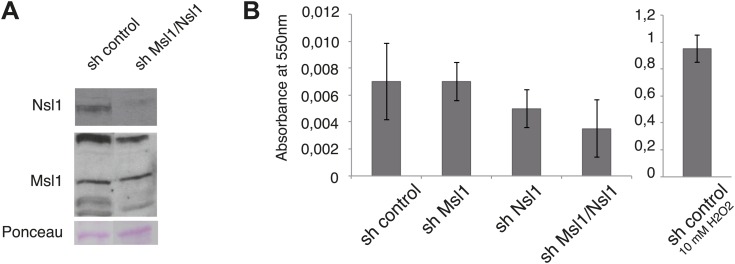
Figure 6—figure supplement 1. shMsl1, shNsl1 and double KD mESCs do not undergo apoptosis.

Figure 6—figure supplement 1.

(A) mESCs were treated with sh control or a mix of sh Msl1 and sh Nsl1 (sh Msl1/Nsl1) expressing lentiviral vectors. 5 days after lentiviral infection Msl1 and Nsl1 downregulation in sh control or sh Msl1/Nsl1 mESCs was tested by Western Blot. 20 μg of proteins were loaded per lane and normalized by ponceau staining and the blots were revealed with the indicated antibodies. (B) Cell death analyses of sh control, sh Msl1, sh Nsl1 and sh Ms1/Nsl1 mESCs 6 days after lentiviral infection. Sh control mESCs treated with 10 mM of H2O2 were used as positive control. Phosphatidylserine appearance at the outer cell membrane of apoptotic cells was analysed by colorimetric measurement at 550 nm using the APOpercentage assay.