. 2014 Jun 4;3:e02104. doi: 10.7554/eLife.02104

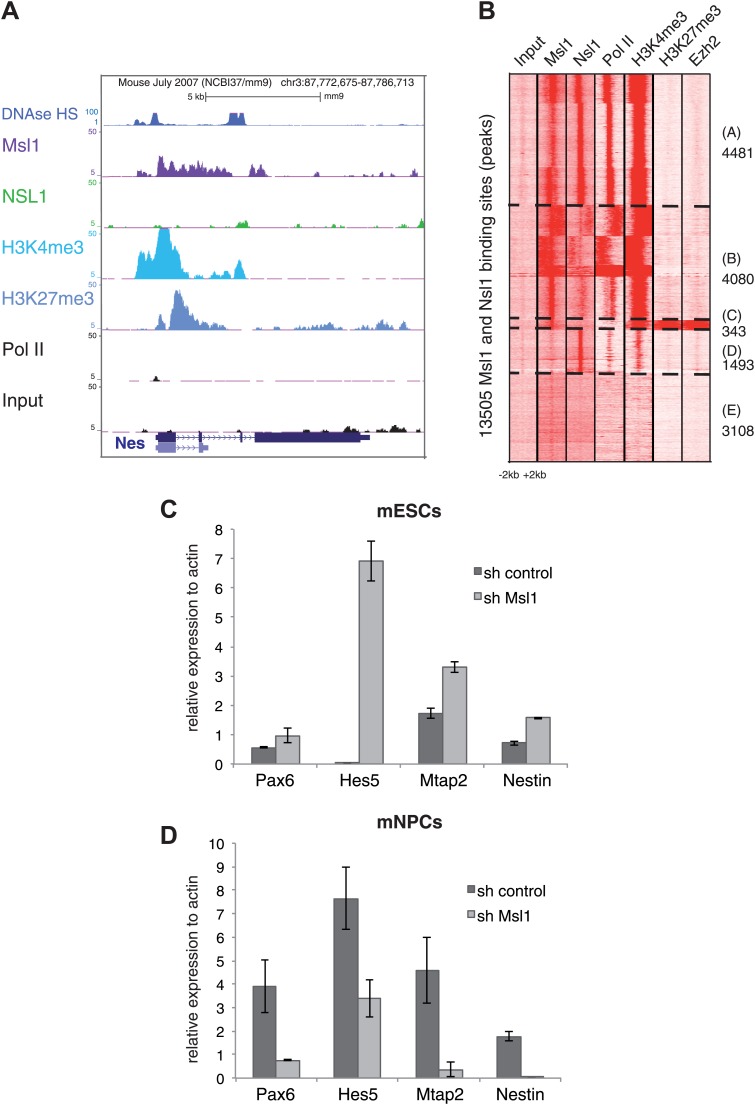
Figure 8. MSL regulates mESC differentiation.

(A) Msl1 binding together with Nsl1, H3K4me3, H3K27me3 and Pol II at the Nestin locus in mESCs. For the Hes5 gene locus see Figure 8—figure supplement 1A. (B) Heatmap showing k-means clustering of Msl1, Nsl1, Pol II, H3K4me3, Ezh2 and H3K27me3 using all Msl1 and Nsl1 binding sites as reference coordinates. Densities are presented −/+2 kb around reference coordinates. Based on the density profiles of all data sets, the heatmap is divided into different categories (as indicated). For statistical analyses of Msl1 positive bivalent genes in Cluster C see Figure 8—figure supplement 1B. (C and D) mRNA expression measurements by RT-qPCR of bivalent genes, which are also key markers for NPC differentiation, under sh control (dark grey) and sh Msl1 conditions (light grey) in pluripotent mESCs (C) or in mNPCs (D) NPC formation and KD efficiency of Msl1 in NPCs was validated in Figure 8—figure supplement 1C,D.

DOI: http://dx.doi.org/10.7554/eLife.02104.021

Figure 8.

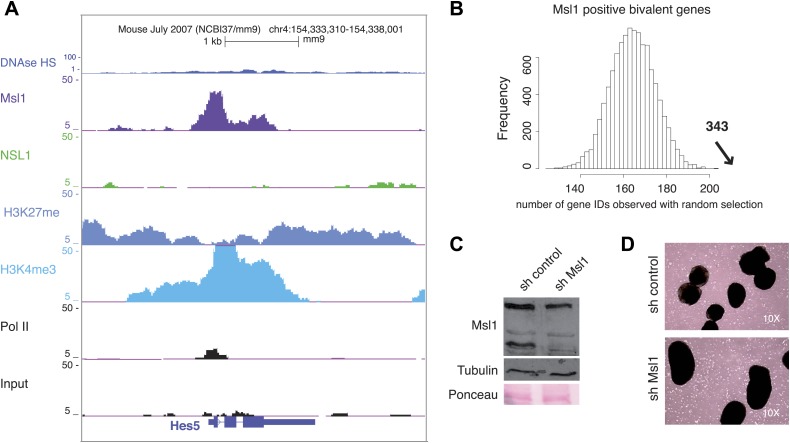
Figure 8—figure supplement 1. MSL binds to bivalent genes.

Figure 8—figure supplement 1.

(A) H3K27me3 and Ezh2 profiles together with Nsl1, Msl1, H3K4me3 and Pol II at the bivalent Hes5 gene at the UCSC genome browser. The input serves as negative control. (B) Bootstrap statistical analyses (‘Materials and methods’) were carried out with a random selection of 13,505 genes (IDs) out of a total pool of 26,460 ENSEMBL IDs. The histograms represent the average numbers of observed IDs in the random sets. The average number and SD is: 165 ± 10 using a random selection (p-value=4.48e−66). The experimentally obtained 343 Msl1 positive bivalent genes in Cluster C (indicated by a bold arrow) is significantly far from the average of randomly selected gene IDs. (C and D) mESCs were treated with sh control or sh Msl1 expressing lentiviral vectors, 5 days after lentiviral infection mESCs were cultured without LIF. RA was added for additional 4 days to induce NPC formation. (C) Msl1 downregulation in sh control, or sh Msl1 conditions were tested by Western Blot as indicated. 20 μg of proteins were loaded per lane and normalized by tubulin and ponceau staining. (D) Morphology was analysed with a reverse-phase microscope using a 10x magnification.