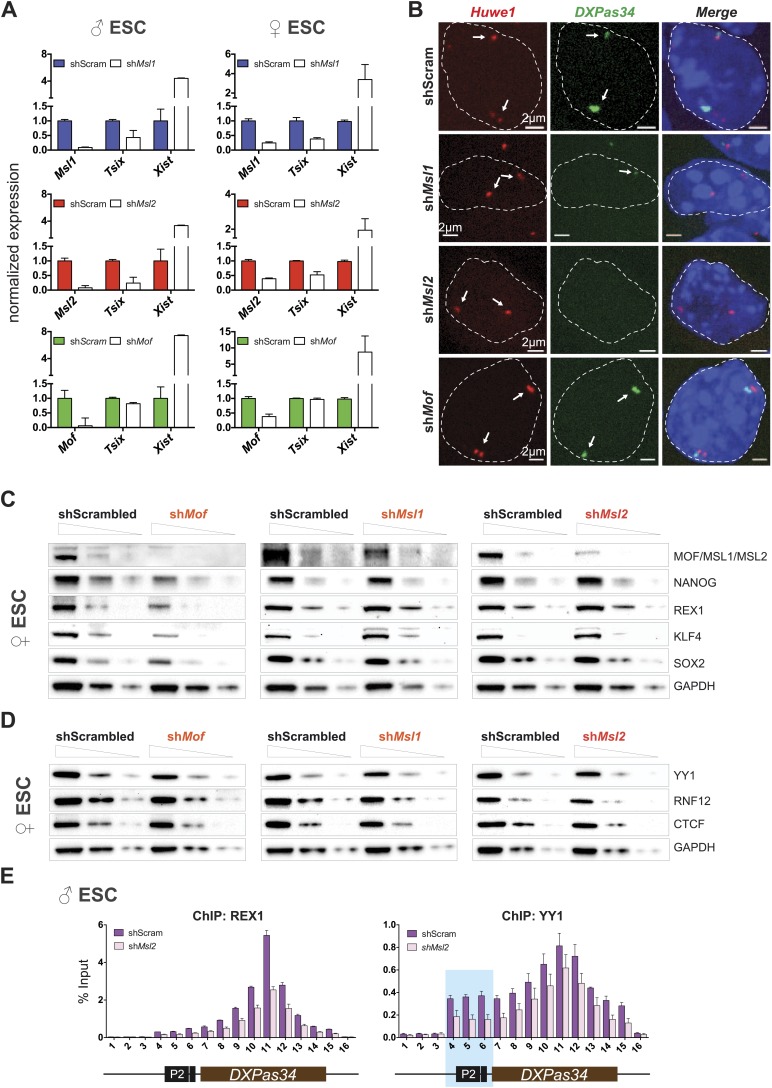
Figure 6. Depletion of MSL1 and MSL2 leads to downregulation of Tsix with concomitant upregulation of Xist.
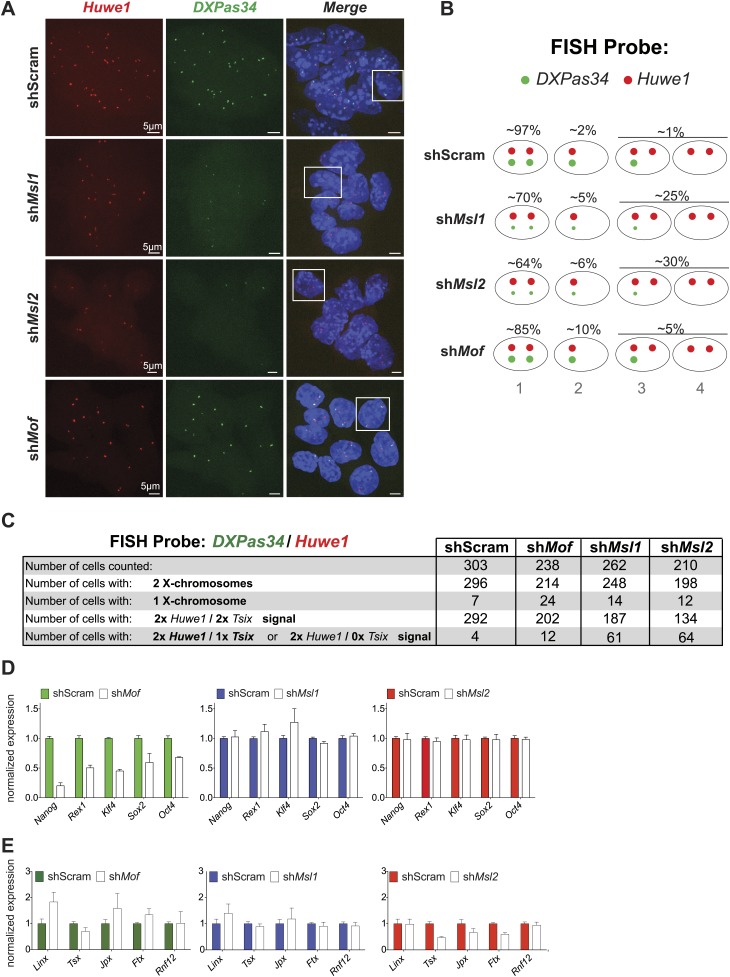
(A) Gene expression analysis for the indicated genes in male and female ESCs treated with scrambled RNA (shScram) or shRNA against Msl1, Msl2, or Mof. All results are represented as relative values normalized to expression levels in shScram (normalized to Hprt) and expressed as means ± SD in three biological replicates. (B) RNA-FISH for Huwe1 (red) and DXPas34 (green) in: scrambled control, shMsl1-, shMsl2-, and shMof-treated female ESCs. Nuclei were counterstained with DAPI (blue). White arrows denote foci corresponding to Huwe1 or Tsix; dashed lines indicate nuclei borders. For additional images, phenotypes and quantifications see Figure 6—figure supplement 1A–C. For probe references see ‘Materials and methods’. (C) Western blot analyses of the pluripotency factors in scrambled-, Mof-, Msl1-, and Msl2-shRNA-treated female ESCs. For corresponding expression analyses see Figure 6—figure supplement 1D,E. The respective dilution (100%, 30%, 10%) of loaded RIPA extracts is shown above each panel. GAPDH was used as the loading control. For antibodies see ‘Materials and methods’. (D) Western blot analyses of the transcription factors involved in regulation of the XIC in scrambled-, Mof-, Msl1-, and Msl2-shRNA-treated female ESCs. The respective dilution (100%, 30%, 10%) of loaded RIPA extracts is shown above each panel. GAPDH was used as the loading control. (E) ChIP-qPCR analysis of REX1 (left panel) and YY1 (right panel) across the Tsix major promoter (P2) and DXPas34 in male ESCs treated with the indicated shRNAs. The labels of the x axes correspond to the arrowheads in Figure 5A. For all ChIP experiments, three biological replicates were used; results are expressed as mean ± SD; cells were harvested on day 4 (Msl2) or 5 (Mof) after shRNA treatment.


