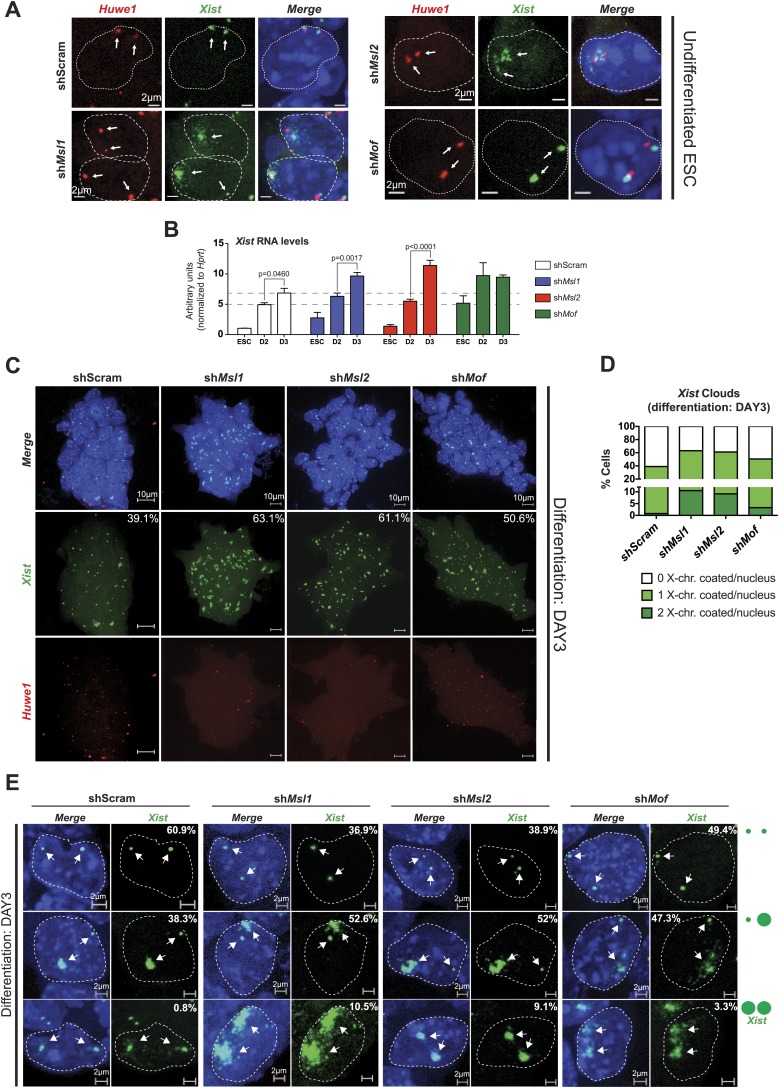
Figure 7. MSL1 and MSL2 depletion leads to enhanced and chaotic Xist accumulation in early differentiation.
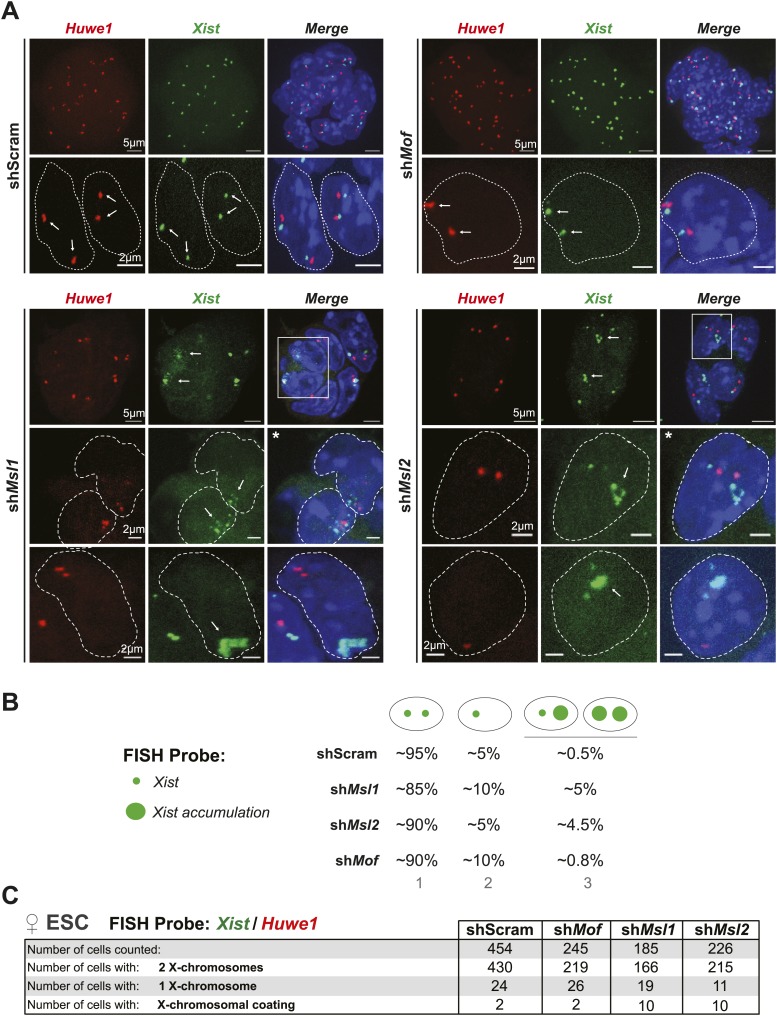
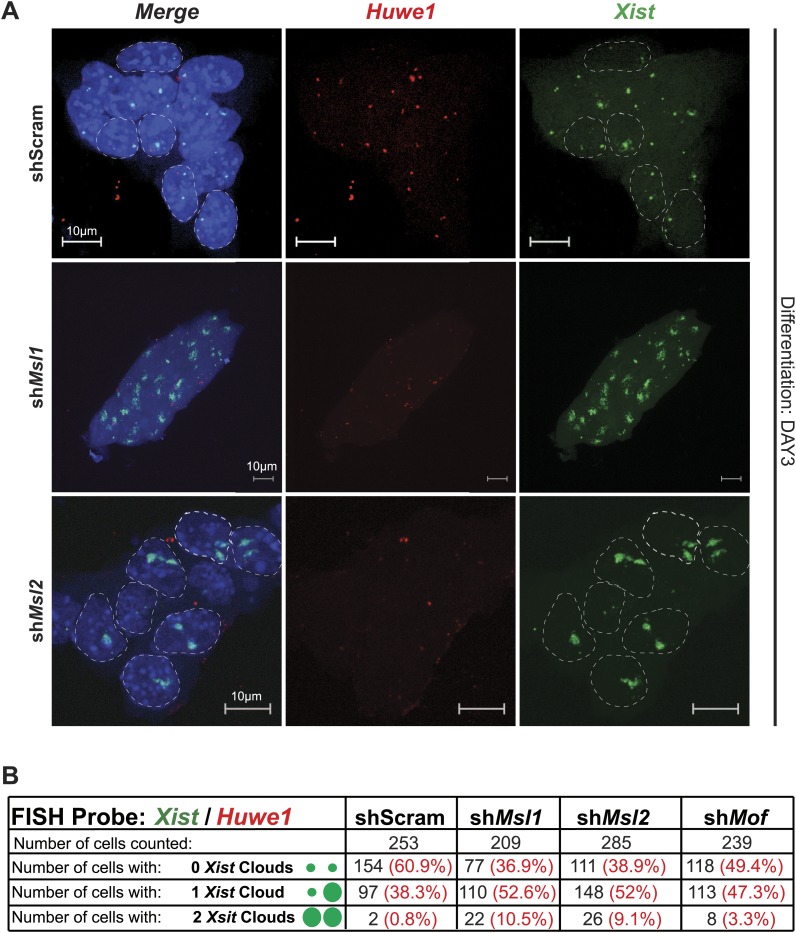
(A) RNA-FISH for Huwe1 (red) and Xist (green) in: scrambled control, shMsl1-, shMsl2-, and shMof-treated female ESCs. Nuclei were counterstained with DAPI (blue). White arrows denote foci corresponding to Huwe1 or Xist; dashed lines indicate nuclei borders. For additional images, phenotypes and quantifications see Figure 7—figure supplement 1B–D. For probe references see ‘Materials and methods’. (B) Expression analysis for Xist in undifferentiated, day 2 (D2) and day 3 (D3) differentiating female ESCs treated with scrambled RNA (shScram) or shRNA against Mof, Msl1, and Msl2. All results are represented as arbitrary units (Xist expression in undifferentiated ESCs = 1) normalized to expression levels in shScram (normalized to Hprt) and expressed as means ± SD in three biological replicates. p-values for D2-to-D3 expression change were obtained using unpaired t test. (C) RNA-FISH for Huwe1 (red) and Xist (green) in: scrambled control, shMsl1-, shMsl2-, and shMof-treated differentiating female ESCs. Nuclei were counterstained with DAPI (blue). RNA-FISH was performed on the sixth day of knockdown (after 72 hr of differentiation). Percentages indicate number of cells with at least one Xist cloud for each of the knockdowns. For additional images of multicellular colonies see Figure 7—figure supplement 2A. (D) Bar plot summarizing the percentage of Xist clouds for individual knockdowns in differentiating (DAY3) female ESCs for individual knockdowns. Cells were divided into three categories: cells carrying no Xist clouds (white), single Xist cloud (light green), or two Xist clouds (dark green). For quantifications, see Figure 7—figure supplement 2B. (E) RNA-FISH for Xist (green) in: scrambled control, shMsl1-, shMsl2-, and shMof-treated differentiating (DAY3) female ESCs. Here, we show examples of individual nuclei carrying different patterns of Xist accumulation. Percentages correspond to the frequency of the shown Xist pattern within the population of cells. White arrows denote Xist foci; dashed lines indicate nuclei borders. For quantifications see Figure 7—figure supplement 2B.


