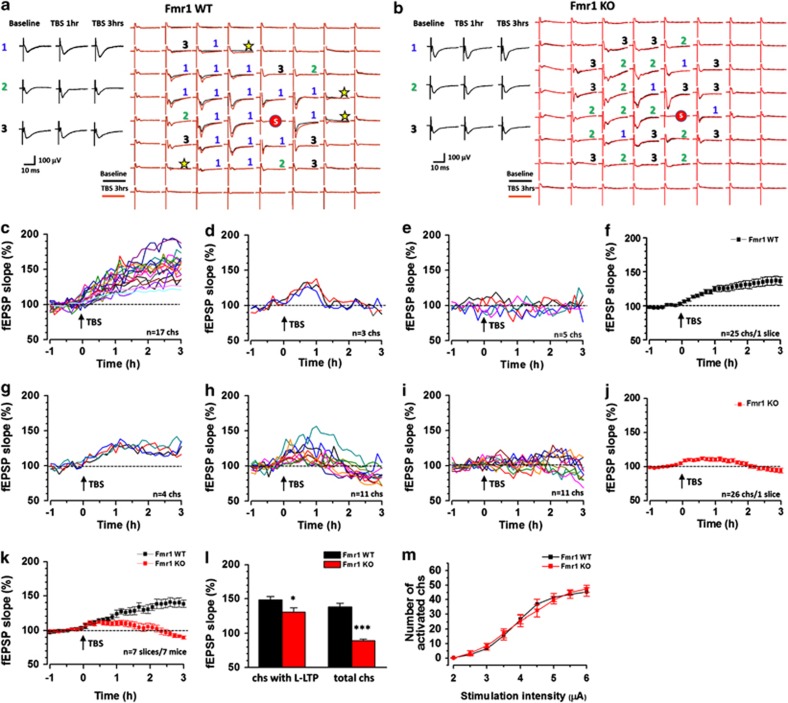
Figure 2.
Network plasticity of the fEPSPs after L-LTP induction in the ACC of Fmr1 WT and KO mice. (a, b) Two mapped figures show the evoked field potentials in the ACC of Fmr1 WT (a) and KO (b) mice. Field potentials were recorded from the other 63 channels 0.5 h before (black) and 3 h (red) after TBS being delivered to one channel marked as ‘s'. Asterisks from the mapped figure of Fmr1 WT mouse indicate the channels with recruited fEPSPs. Superimposed sample traces at different time points (baseline and 1 and 3 h after TBS) show three types of plasticity: channels showing typical L-LTP are marked as (1), in which gradually increased slope of the fEPSP could be detected after TBS and lasted for 3 h; channels showing relative short-term potentiation after TBS (decline within 1.5 h) are marked as (2); channels without change in the slope of the fEPSP are marked as (3). The fEPSP slope of 17 channels with L-LTP (c), 3 channels with short-term potentiation (d), and 5 channels without potentiation (e) from 1 slice of 1 Fmr1 WT mouse is shown, respectively. The averaged slope of the total 25 channels is shown in (f). The fEPSP slope of 4 channels with L-LTP (g), 11 channels with short-term potentiation (h), and 11 channels without potentiation (i) from 1 slice of 1 Fmr1 KO mouse is shown, respectively. The averaged slope of the total 26 channels is shown in (j). (k) Time course of the averaged fEPSP slope of all recorded channels in Fmr1 WT and KO mice (seven slices/seven mice in each group). (l) The averaged slope of fEPSPs from channels with L-LTP and from total active channels of Fmr1 WT and KO mice. *p<0.05, ***p<0.001. (m) The number of activated channels induced by different stimulation intensities (input–output) in Fmr1 KO mice and WT mice.

