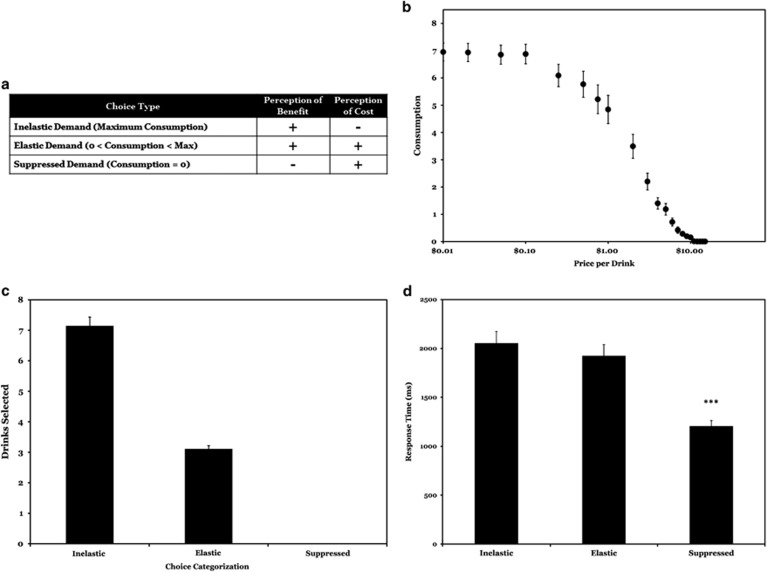
Figure 1.
Behavioral performance during an fMRI alcohol purchase task. (a) The cost–benefit designations associated with the trichotomous event designation. (b) The aggregated empirical alcohol demand curve based on participant choices. (c) The average number of drinks associated with the trichotomous categorization; all choice types were significantly different from each other (p's<0.001). Error bars reflect SEM. (d) Reaction time during the three choice categories; significant differences are present between Inelastic and Elastic choices compared with Suppressed choices but not relative to each other (***p<0.001).

