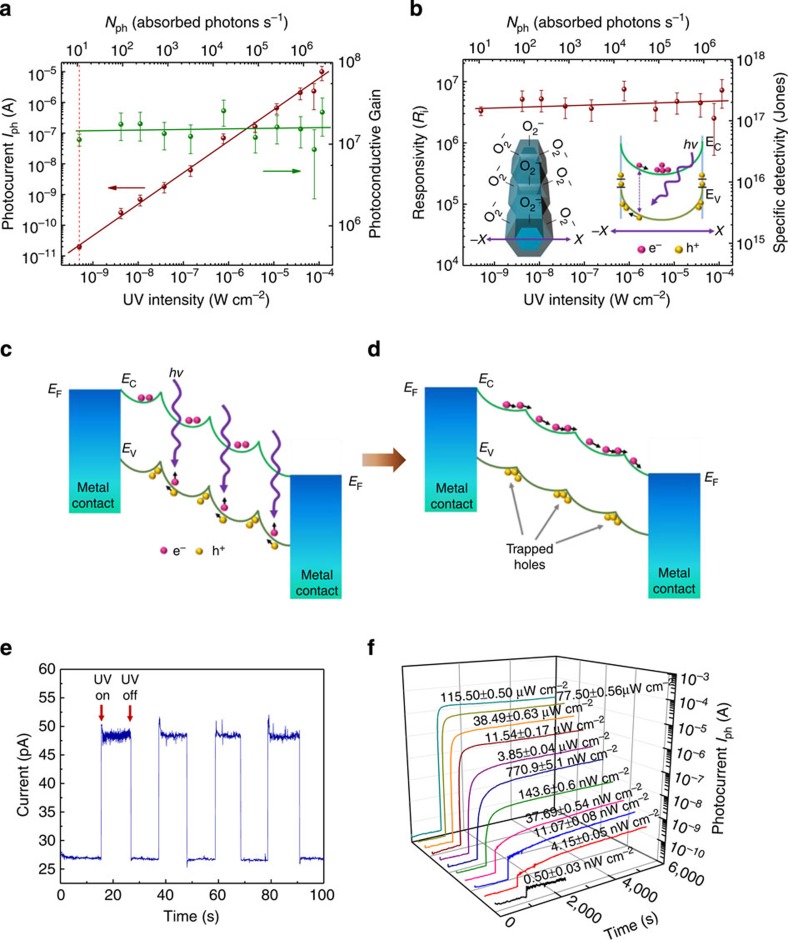
Figure 3. Performance characterization of GNWs photodetectors.
(a) Photocurrent and photoconductive gain of a GNW photodetector as a function of UV excitation intensity from 0.5 nW cm−2 to 115.5 μW cm−2 measured with +1 V bias. The error bars represent s.d. of multiple measurements of photocurrent for each light intensity. (b) The corresponding responsivity and specific detectivity of the GNW photodetector. Inset: schematic of oxygen adsorption on NW surface and the resulting radial direction band bending. The error bars represent s.d. of multiple measurements of photocurrent for each light intensity. (c,d) Schematics of carrier transport mechanism in the GNW photodetector upon UV illumination. (e) Time domain photoresponse of the GNW photodetector under low UV intensity of 0.5 nW cm−2 at +1 V bias voltage by manually turning on and off the UV light source. (f) The photocurrents time domain measurements of ZnO GNWs photodetector at UV intensity ranging from 0.5 nW cm−2 to 115.5 μW cm−2 with +1 V bias.

