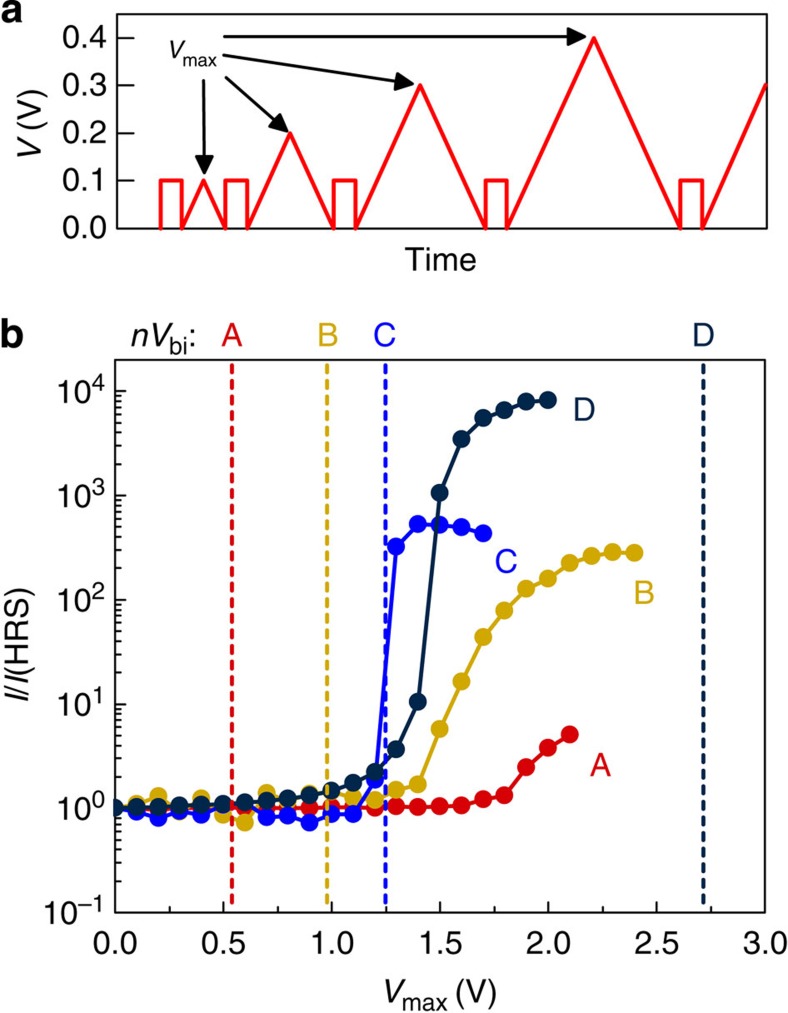
Figure 3. Switching characteristics of the devices.
(a) Applied voltage sequence used for testing the switching from HRS to LRS. The sequence consisted of alternating between 0.1 V read pulses and increasingly large switching biases. (b) Normalized small-signal currents plotted as a function of peak voltage in the switching loop. The effective built-in voltages, V=nVbi, are indicated by the dashed lines.

