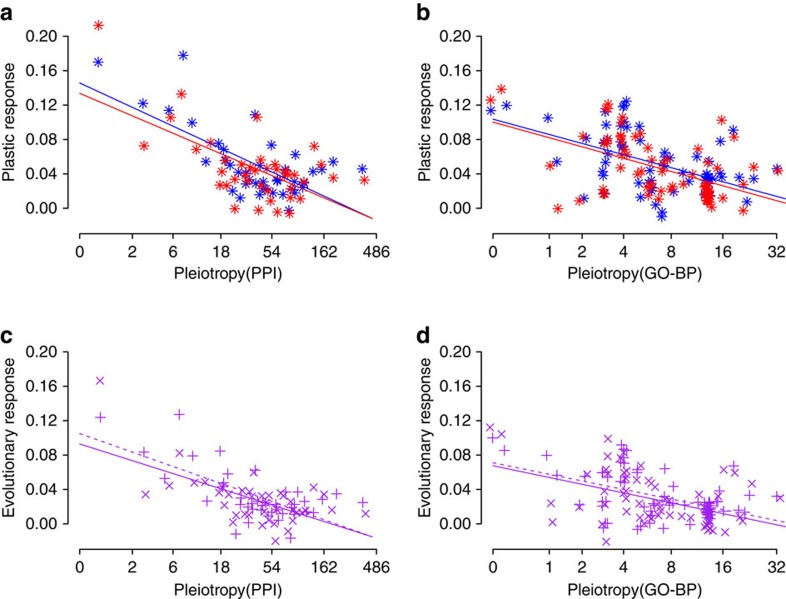
Figure 4. Constraining effect of gene pleiotropy on plastic and evolutionary protein expression responses.
(a,b) Plastic response of protein expression is represented as the difference in mean protein expression level between 6 °C and 10 °C temperature treatments in grayling of cold (blue colour) and warm (red colour) thermal origin. (a) Pleiotropy estimated by PPI: GLMM, type II Wald’s F tests with Kenward–Roger df: P=1.04E−25, n=960, bootstrap support=100%. (b) Pleiotropy estimated by GO-BP: P=4.99E−05, n=960, bootstrap support=81%. (c,d) Evolutionary response in protein expression represented as the difference in mean protein expression level between grayling of cold and warm thermal origins in the 6 °C (× symbol, continuous line) and 10 °C (+ symbol, dashed line) temperature treatment. (c) Pleiotropy estimated by PPI: P=7.05E−10, n=960, bootstrap support=93%. (d) Pleiotropy estimated by GO-BP: P=1.04E−04, n=960, bootstrap support=76%. P-values for the plastic response represent the interaction between gene pleiotropy and temperature treatment, and for evolutionary response the interaction between gene pleiotropy and thermal origin. Mild jittering of the points along the x axis was applied to improve plot clarity. Lines are linear regression fits used for visualization. These results derived from GLMM analysis on mean standardized protein expression levels of grouped proteins (bin=10 proteins).

