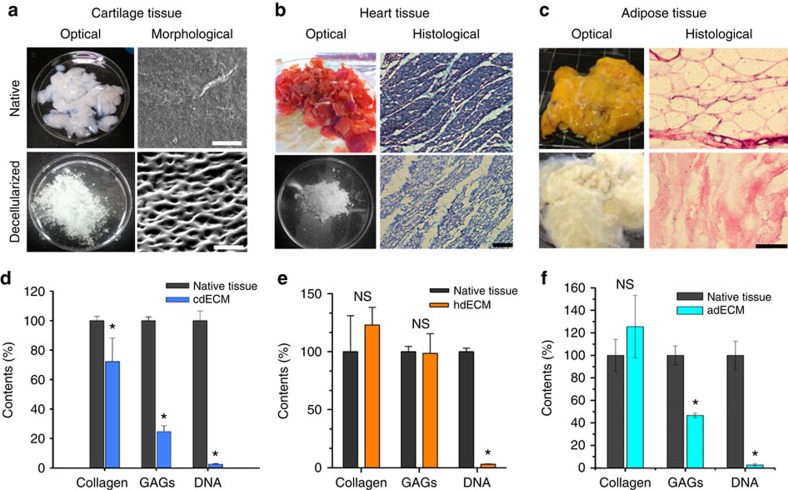
Figure 2. Decellularization of the native tissues and their biochemical analysis.
Optical and microscopic images of native and decellularized (a) cartilage tissue (scale bar, 50 μm), (b) heart tissue (scale bar, 100 μm), and (c) adipose tissue (scale bar, 100 μm). ECM components (Collagen and GAGs) and DNA contents of native and decellularized (d) cartilage (cdECM), (e) heart (hdECM) and (f) adipose (adECM) tissue. All experiments were performed in triplicate. Error bars represent s.d. (*P<0.05; NS, no significance).

