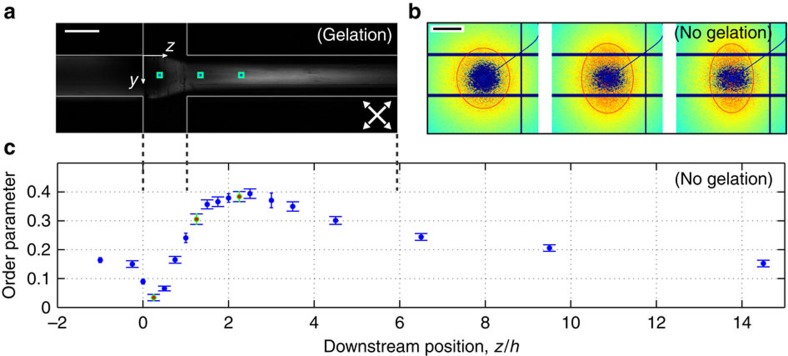
Figure 4. Alignment and de-alignment of fibrils in the channel.
(a) A NaCl solution is focusing an CNF dispersion. The channel is placed between two crossed polarization filters rotated 45° from the vertical axis (white arrows). (b) SAXS diffractograms from before, during and after the acceleration by pure water in the channel, where the red ellipse corresponds to a constant intensity. The locations are marked with green squares around blue markers in a. (c) Order parameter from acceleration by pure water calculated from SAXS data as a function of downstream distance normalized with the channel width h=1 mm. The error bars represent the s.d.’s between different q-values. The scale bar in a is 1 mm and in b 0.5 nm−1.

