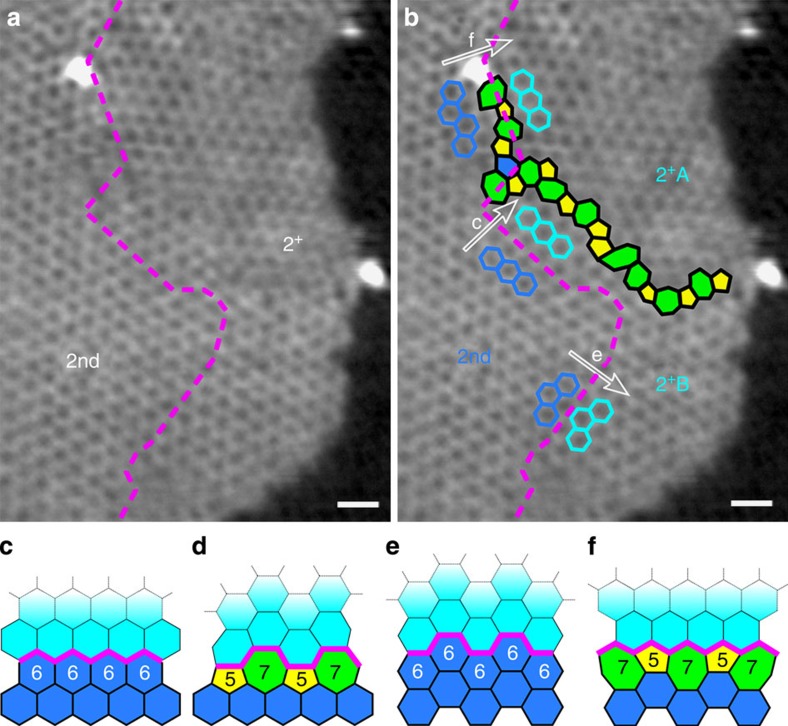
Figure 4. Growth model determined by step-edge structure.
(a) A filtered image of Fig. 2d only showing the 2nd and 2+-layer graphene. The dashed magenta lines indicate the edge of initial 2nd layer. (b) Identical image to a with highlighted 5–7 defect structure (yellow pentagon and green heptagon). Blue hexagons stand for the initial 2nd-layer structure, from where the 2+ layer (cyan hexagons) grows along the white arrows. (c–f) Four categories of the growth model. (c) From ZZ to ZZ, (d) from reconstructed ZZ (57) to AC, (e) from AC to AC and (f) from reconstructed AC (57) to ZZ. Scale bar, 0.5 nm.

