Fig. 4.

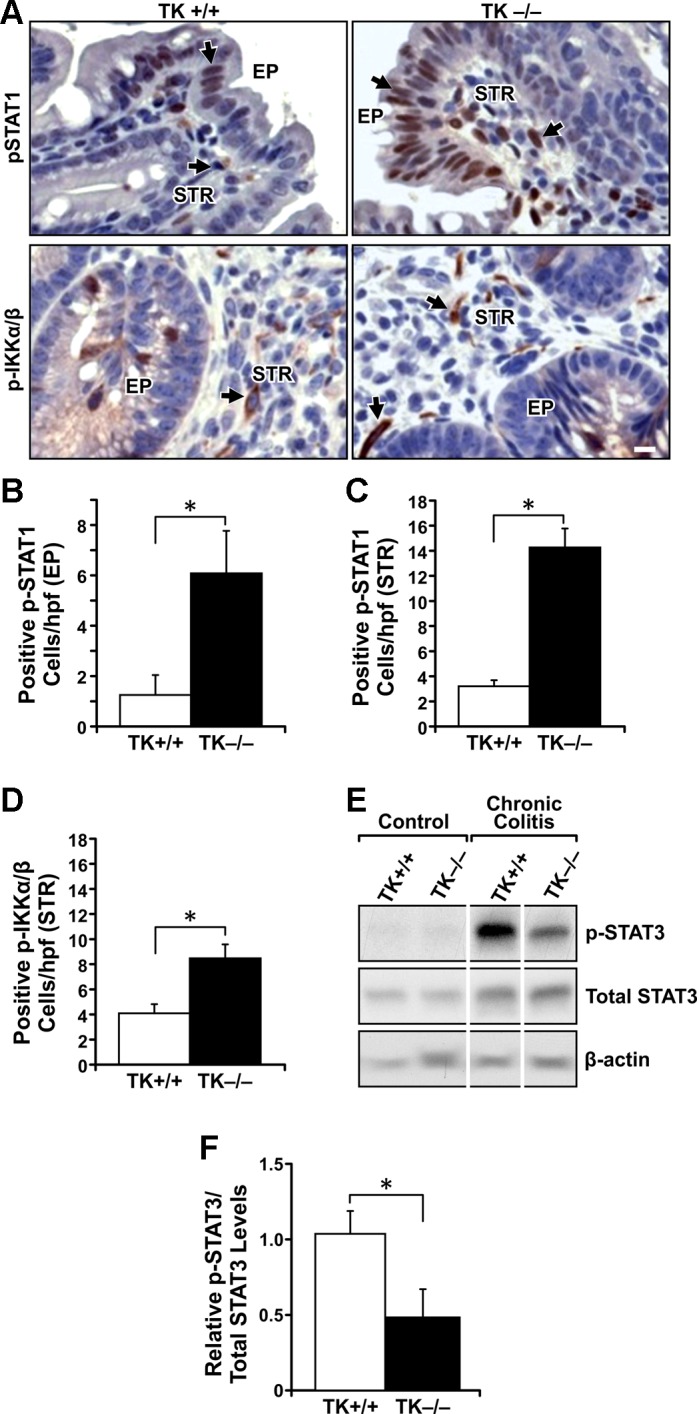
Signaling differences between TK+/+ and TK−/− colons after the induction of chronic colitis. IHC analyses for phosphorylated (p)-STAT1 and p-IKK-α/β (A) in colons of TK+/+ and TK−/− mice after DSS-induced colitis. Quantification of p-STAT1-positive cells in the colon epithelium (EP) (B) shows more p-STAT1-positive cells in TK−/− mice. Quantification of p-STAT1 (C) and p-IKK-α/β (D) cells in the colonic stroma (STR) shows more positive cells in TK−/− colons after DSS treatment. Western analyses of colons from TK+/+ and TK−/− mice before (Control) and after DSS treatments show more p-STAT3 in TK+/+ mice after colitis (E). Densitometry analysis for p-STAT3 expression normalized to total STAT3 is shown (F). *P < 0.05, scale bar = 50 μm. Images are representative of n = 5–6 mice per group with histograms representing the mean ± SE of n = 5–6 per group, *P < 0.05.
