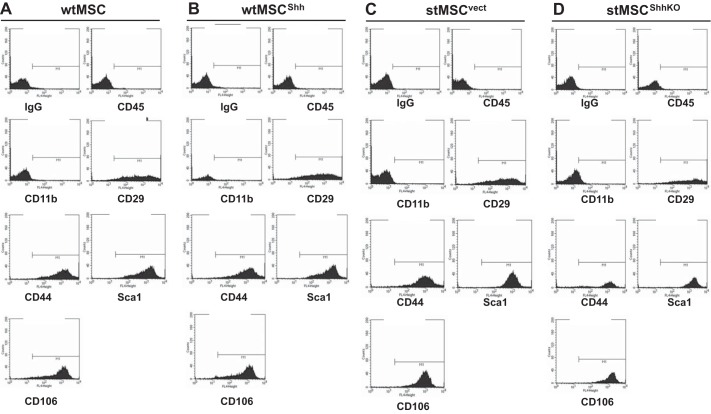
Fig. 3.
Characterization of the transduced wtMSC and stMSC cell lines. An expression pattern for the classical cluster-of-differentiation (CD) markers (CD29, CD106, CD105, CD44, CD73 CD45, and CD11b) and Sca-1 was analyzed using flow cytometry and wtMSC (A), wtMSCShh (B), stMSCvect (C), and stMSCShhKO cells (D).

