
Fig. 2.
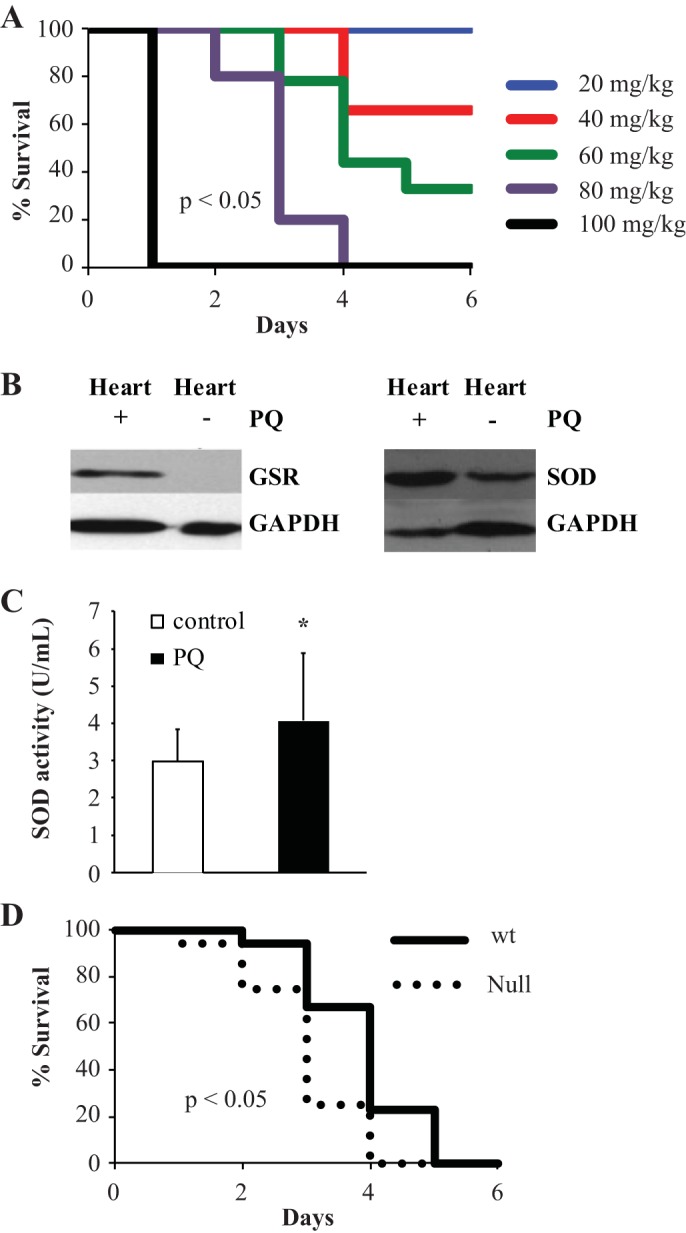
Paraquat dichloride (PQ) generates ROS in vivo and is toxic. A: Kaplan-Meier survival curve for wild-type mice treated with referenced concentrations of PQ (n = 8 mice/group). B: Western blot analysis demonstrating the expression levels of glutathione reductase (GSR) and SOD (SOD) proteins in control or PQ-treated wild-type cardiac tissue. C: SOD activity measured by a SOD assay kit for control or PQ-treated wild-type cardiac samples. D: wild-type (solid line) and Abcg2-null (dotted line) survival after 70 mg/kg PQ treatment (n = 17 mice/group). *P < 0.05.