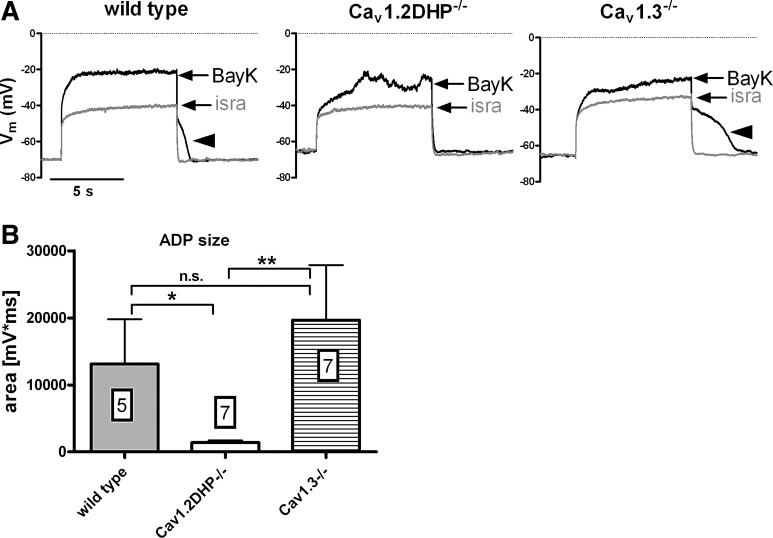
Fig. 5.
Size of ADPs in neurons of wild-type and LTCC-gene modified mice. A: overlays of traces recorded in the presence of BayK and isradipine exemplify pronounced bump responses in neurons of wild-type (left), Cav1.2DHP−/− (middle), and Cav1.3−/− mice (right) that were selected for evaluation of the ADP size. Arrowheads indicate distinct depolarizing afterpotentials. B: average area of ADPs (mV·ms) recorded in the presence of BayK in response to 8 s-long current injections is displayed for neurons from the 3 mouse strains as indicated. Boxed figures indicate the number of experiments. Statistical analysis revealed a significant difference between wild-type and Cav1.2DHP−/− data (*P < 0.05), between Cav1.2DHP−/− and Cav1.3−/− data (**P < 0.01), but not between wild-type and Cav1.3−/− data (n.s., not significant).

