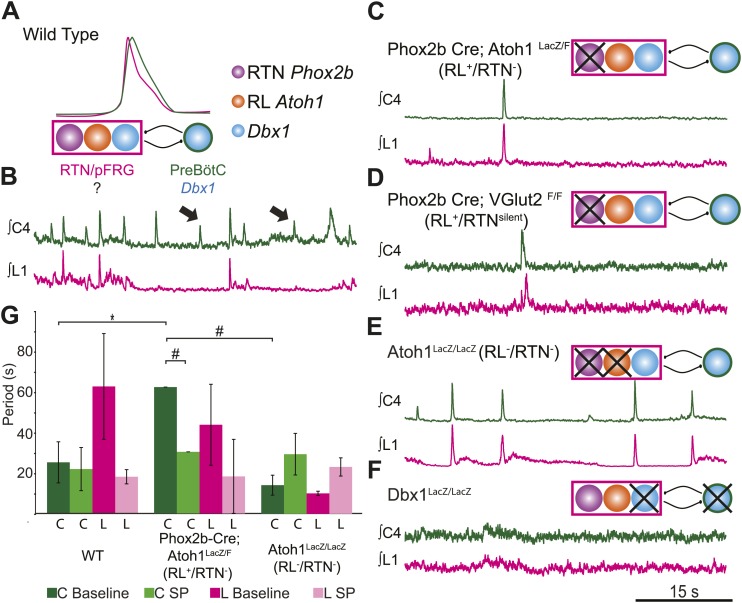
Figure 3. RL and RTN neurons are neither necessary nor sufficient for lumbar respiratory output.
(A) Schematic cartoon describing populations targeted for genetic elimination to determine necessity for generating cervical (green) and/or lumbar (magenta) respiratory output. Colored filled circles indicate the developmental origin of RL Atoh1 (orange), RTN Phox2b (purple), or Dbx1 (blue) derived neurons with schematic as in Figure 1B. (B) 50 s integrated recordings of spontaneous respiratory output from cervical (C4, green) and lumbar (L1, magenta) motor roots in an E18.5 WT isolated hindbrain-spinal cord preparation showing normal lumbar-cervical coordinated respiratory output. Upward deflections indicate respiratory-related events. Arrows indicate fictive breaths where cervical output is not matched by lumbar output. Targeted ablation (C, Phox2b-Cre;Atoh1LacZ/F [RL+/RTN−]) or silencing (D, Phox2b-Cre;VGlut2F/F [RL+/RTNsilent]) of RTN Phox2b neurons does not eliminate lumbar respiratory output. Schematics (C–D, upper right) indicate targeted loss of Phox2b RTN neurons (purple). Note the marked increase in respiratory period (i.e., slowing of frequency). (E) Loss of both RTN Phox2b and RL Atoh1 neurons in Atoh1LacZ/LacZ (RL−/RTN−) mice similarly does not eliminate lumbar respiratory output. Schematic (upper right) indicates targeted loss of both Phox2b RTN (purple) and RL Atoh1 neurons (orange). (F) Loss of Dbx1-dependent neurons in Dbx1LacZ/LacZ mice eliminates both lumbar and cervical respiratory outputs. Schematic (upper right) indicated targeted loss of Dbx1 neurons (blue). Scale bar = 15 s. (G) Loss of RTN Phox2b neurons slows the respiratory rhythm, thus increasing the cervical period. Bar graphs show least-squares mean (LSMEAN) of respiratory periods in seconds (±SEM) during baseline (cervical–[C], dark green, lumbar–[L], magenta) or in the presence of 1 µm SP (cervical–[C], light green, lumbar–(L), pink) in wild-type (WT) (n = 6), Phox2b-Cre;Atoh1LacZ/F (RL+/RTN−) (n = 4), and Atoh1LacZ/LacZ (RL−/RTN−) (n = 5) mice. Top brackets indicate statistical test groups (*p<0.05, #p<0.001; mixed random effects ANOVA).

