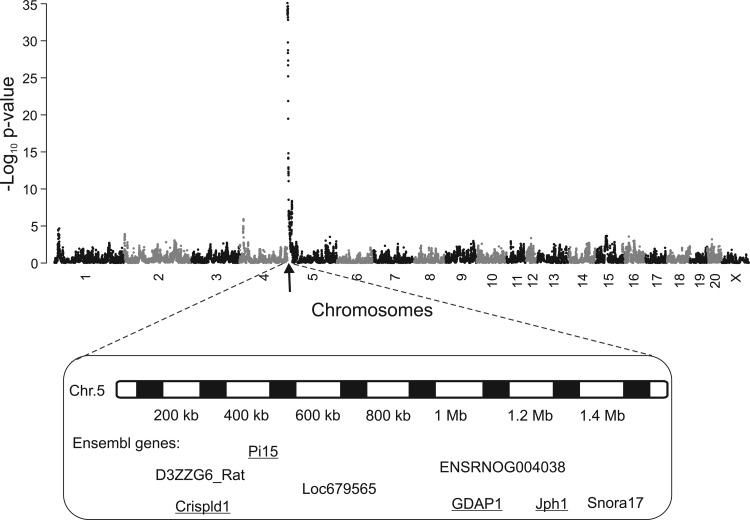
Fig. 4.
Association mapping of RIEL numbers in AA and LIA in HS rats. The x-axis indicates the chromosomal location, and the y-axis gives the negative log10 of the P value of the test of association. The genes shown lie in the 90% confidence interval of the QTL (1 bp to 1.4 Mb). Underlined genes are protein-coding, and others are hypothetical proteins.

