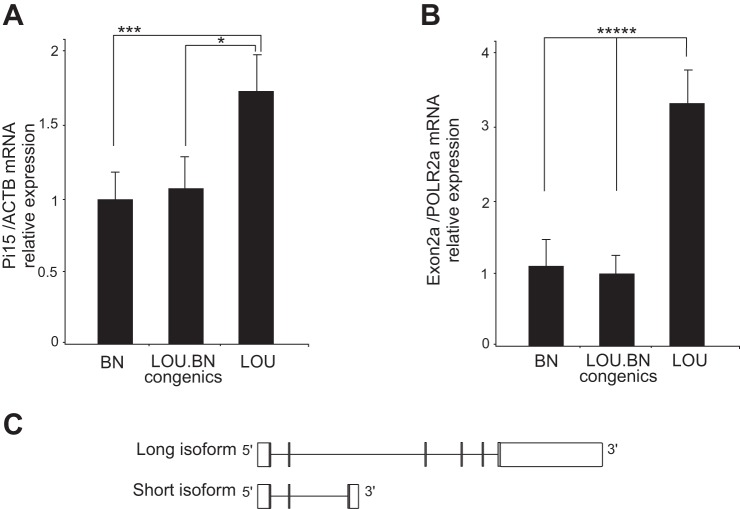
Fig. 6.
Validation of RNA-seq analysis. A: qRT-PCR showed significant differential expression for Pi15 in BN and congenics compared with LOU; n = 8, 8, 9 per each group. Means ± SD. *P < 0.02, ***P < 0.003. B: RT-PCR of Pi15 exon 2a showed an increased expression of the alternative exon in the LOU compared with BN and congenics; n = 5 per each group. Means ± SD. *****P < 0.00007. C: schematic representation of short and long isoforms of Pi15. Shaded bars show exons, and open bars represent UTRs.

