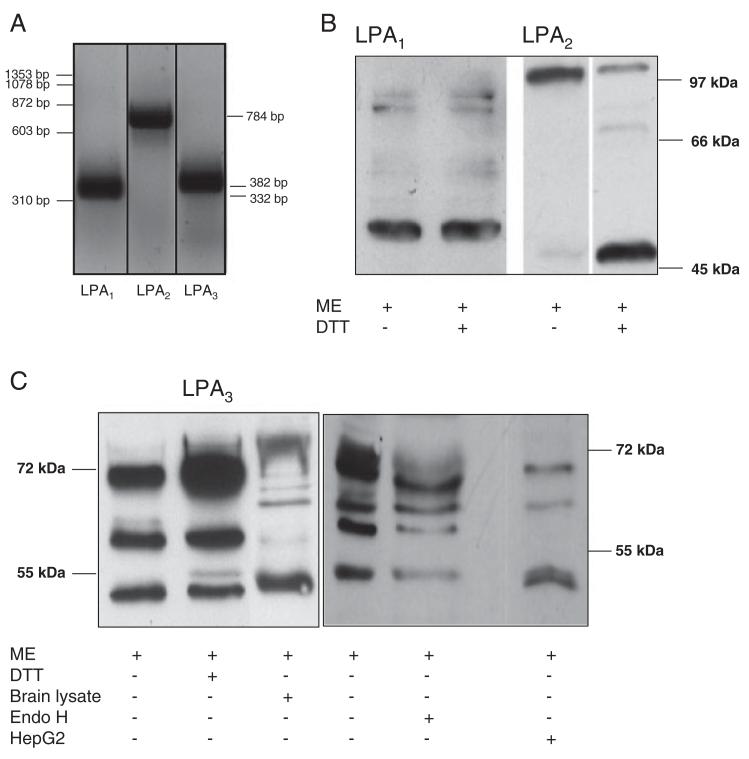
Figure 1.
LPA receptor expression by C13NJ microglia. (A) Expression levels of LPA1–3 transcripts were determined by RT-PCR using the primers and conditions described in Table 1. Lane 1: 100 bp standard. (B and C) Western blot analysis of LPA receptor expression. Fifty micrograms of protein of total cell lysates were reduced under standard conditions (5% mercaptoethanol; ME) or treated additionally with DTT (100 mM) or EndoH followed by SDS-PAGE separation. Blots were probed with polyclonal rabbit anti-human LPA1, anti-human LPA2, or anti-mouse LPA3 anti-serum and HRP-conjugated goat-anti-rabbit antibody as indicated. LPA2 samples were run on two different gels. Immunoreactive bands were visualized using the ECL-detection system. Mouse brain and HepG2 cell lysates were used as control for LPA3 identification.

