Figure 3.

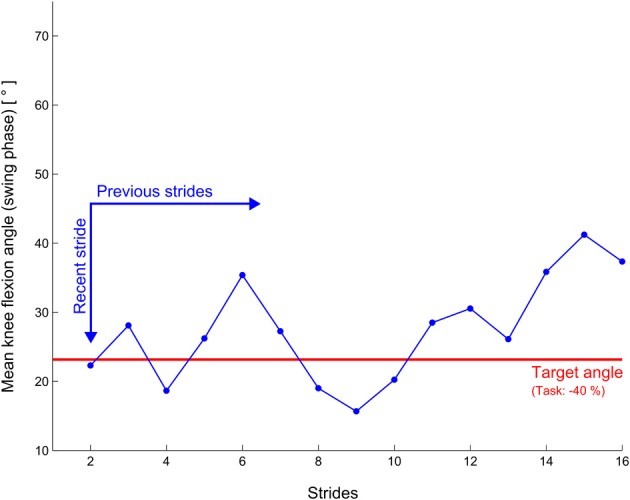
Illustration of the feedback display of the pilot study with non-impaired subjects. The blue graph is shifted to the right on every stride.

Illustration of the feedback display of the pilot study with non-impaired subjects. The blue graph is shifted to the right on every stride.