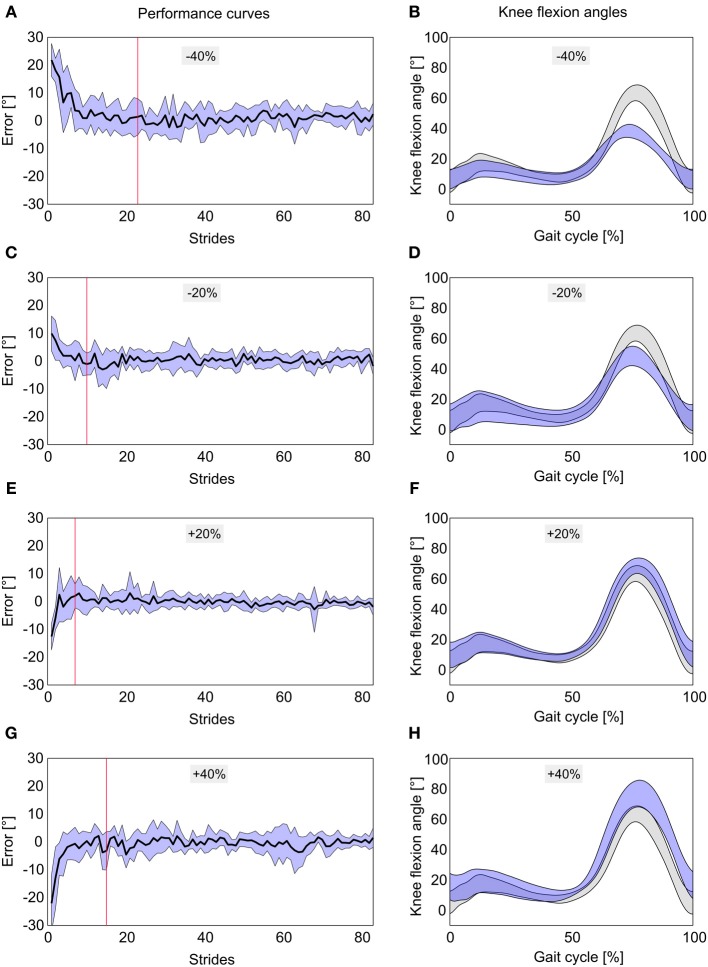
Figure 4.
Performance curves and mean knee flexion angles to the movement tasks −40% (A,B), −20% (C,D), +20% (E,F), and +40% (G,H) of normal knee flexion angles. Performance curves display 83 steps during feedback training averaged over 9 non-impaired individuals ± SD (blue area). Red vertical lines mark the point where the SE of the mean error is within ±1°. Mean knee flexion angles are displayed as blue curves averaged over 9 non-impaired individuals. Gray curves represent mean knee flexion angles ± SD of all participants during normal walking (initial gait analysis).

