Figure 7.
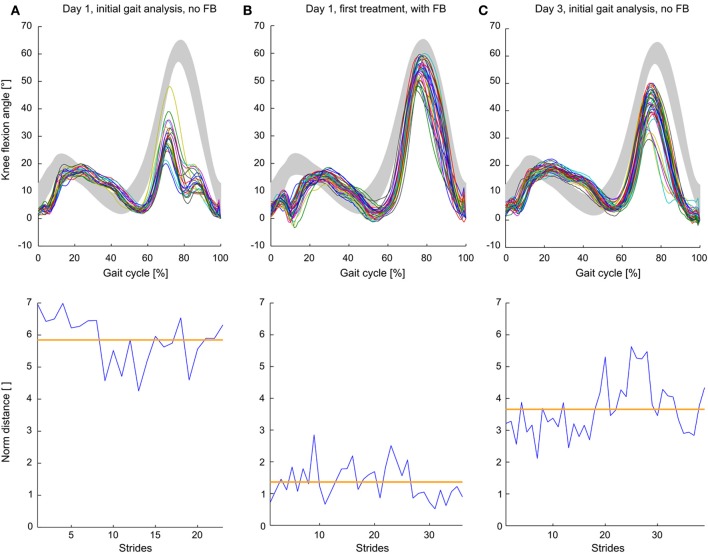
Step normalized knee angle curves and norm distance values of a single individual with iSCI during (A) initial gait analysis (no feedback) on day 1, (B) first feedback trial during the first day of training and (C) initial gait analysis (no feedback) on the third day. Gray curves depict mean knee flexion angles ± SD of non-impaired subjects. Orange lines show mean norm distance values.

