
Figure 5.
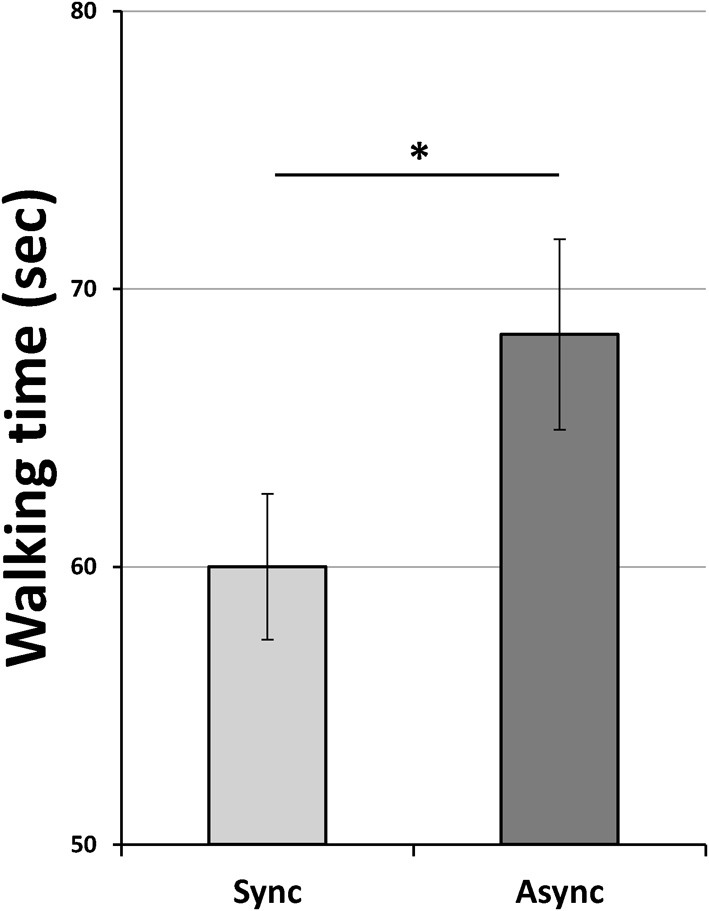
Mean walking time to drive the robot from the first to the second table and drop the bottle. Light-gray and dark-gray columns represent Synchronous and Asynchronous footstep sound heard by participants. Error bars represent s.e.m. Asterisk indicate significant comparisons (p < 0.05).