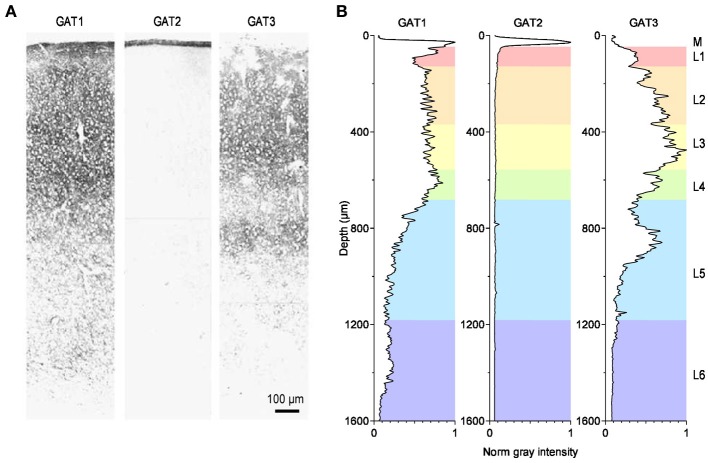
Figure 3.
Distribution of GABA transporters in the rat somato-sensory cortex. (A) Immunohistochemical labeling for the GABA transporters GAT1 (left), GAT2 (middle) and GAT3 (right) in the primary somato-sensory cortex of the adult rat. Modified from (Conti et al., 2004). (B) Image analysis of the immunohistochemical labeling for GAT1-3. The diagrams provide a measure of the normalized, average gray value distribution measured over the entire area of the images shown in panel A. The data are normalized by the maximum gray value measured in each image. Therefore, the darkest areas, with the most intense labeling, have a normalized gray intensity value of 1. The letters on the right hand side of the figure indicate the meningeal (M) and the six cortical layers (L1–6). The gray value analysis was done using the Fiji image processing package (Schindelin et al., 2012). The rest of the analysis was performed using custom-made routines written in Igor Pro (Wavemetrics).

