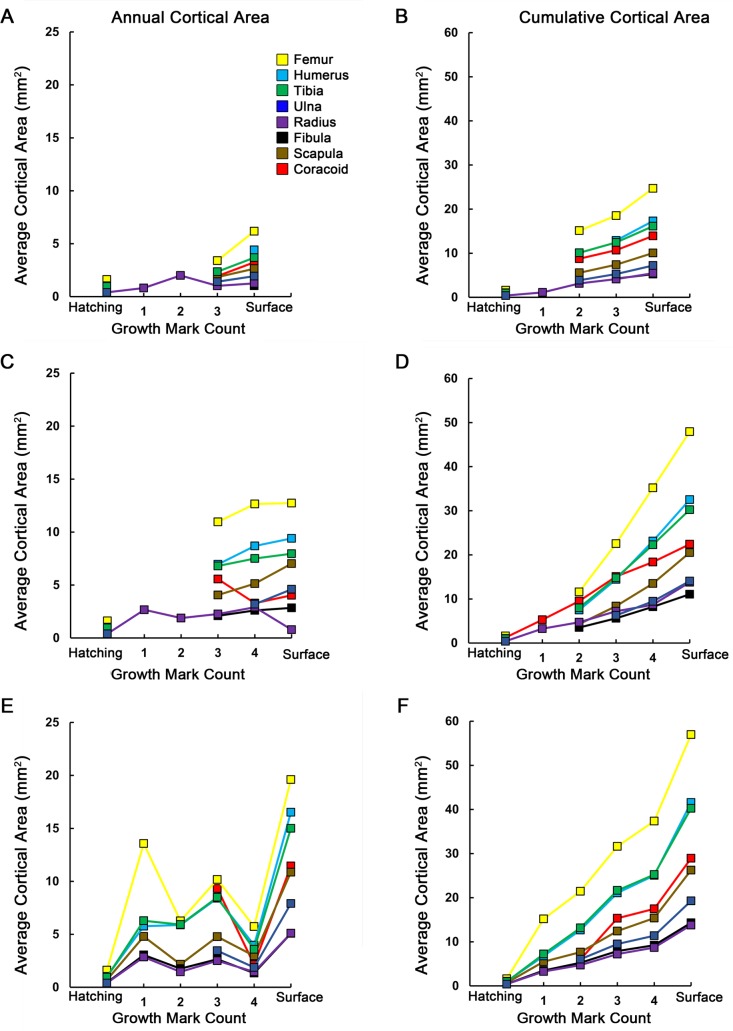
Figure 7. Averages and cumulative averages of annual cortical areas.
Annual average cortical area is the area of a zone between two CGMs (A, C, E), while cumulative average cortical area is the additive area of zones after each year of growth (B, D, F). These measurements provide a two-dimensional record of annual and ontogenetic growth in the elements sampled. In general, skeletal elements of MOR-OST 1648 (A, B) grew at lower rates than either MOR-OST 1649 (C, D) or MOR-OST 1650 (E, F). However, the femur, tibia, and humerus consistently had the highest annual growth rates in each alligator. Lines with no connection to the origin indicate growth marks that were either wholly or partially obliterated by medullary cavity expansion and could not be accurately measured. As exact age of the alligators is unknown, it is more appropriate to plot growth mark count rather than numerical age on the x-axis.

