Figure 6.
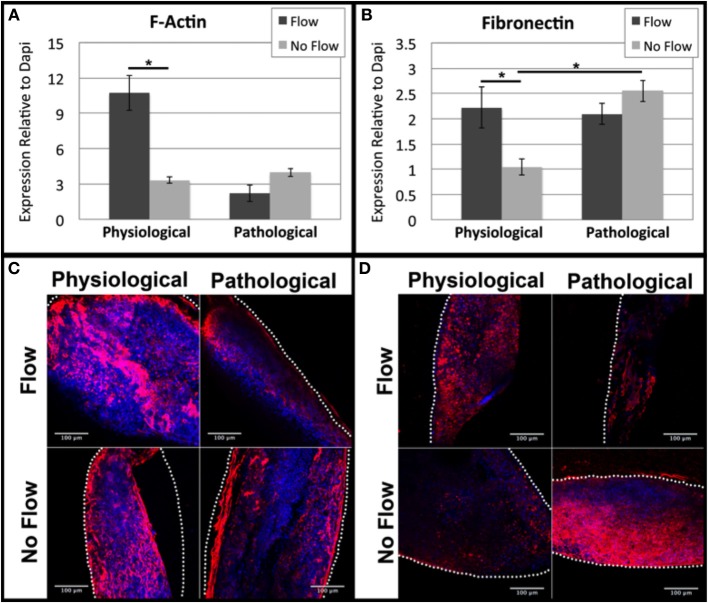
Flow affects cytoskeletal actin and extracellular fibronectin in OFT cells. Mean fluorescence intensity relative to Dapi was quantified from confocal imaging under the same setting for each outflow tract (OFT) explant culture group. (A) F-actin expression was upregulated under physiological flow compared to no flow controls. (B) Fibronectin expression was upregulated under physiological flow compared to no flow controls and extended no flow culture time appeared to upregulate expression. (C) F-Actin and (D) fibronectin expression both exhibited diffuse staining in all sample groups with increased concentration at the scaffold-tissue interface. Scale bars are all 100 μm. The dotted lines indicate the scaffold wall. (*P < 0.05).

