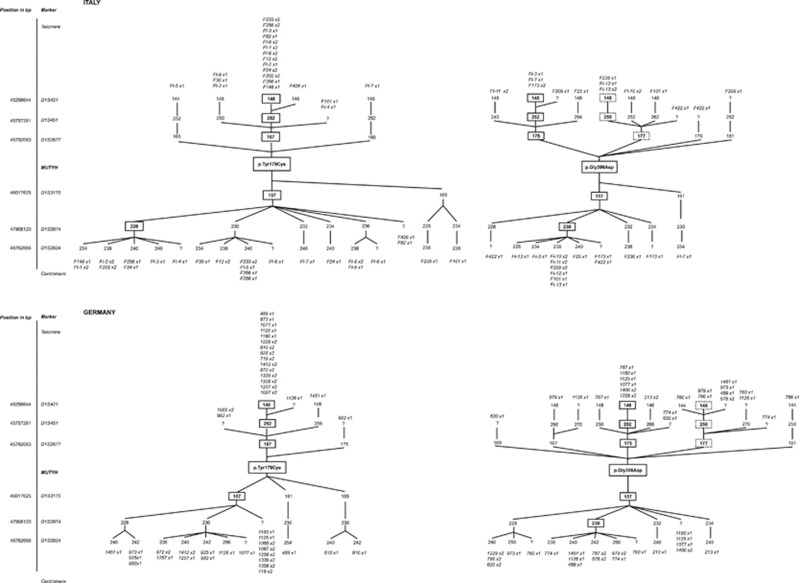
Figure 1.
Haplotype branching trees of p.Tyr179Cys (right) and p.Gly396Asp (left) chromosomes in Italian (top panels) and German (bottom panels) families. The markers used are shown according to their position on the physical map (UCSC Genome Browser Feb. 2009 GRCh37/h19). Boxed numbers indicate STR alleles comprised in the ancestral haplotypes; for p.Gly396Asp, the two most common haplotypes (A and B) are indicated by solid and dashed lines, respectively; non boxed numbers correspond to additional alleles detected in the study families. Family codes are indicated above or below alleles in which they have been identified; for each family, the number of chromosomes with the corresponding allele is indicated as × 1 (1 copy) or × 2 (2 copies).

